Individual components passing their tests is a good sign, but not enough. Modern software is rarely a single, self-contained thing. It’s a collection of modules, APIs, services, and third-party systems that all need to work together, and assuming they will, simply because each piece works in isolation, is one of the more expensive mistakes a team can make. That’s the problem system integration testing, or SIT, exists to solve.
SIT is the process of testing how different software modules or systems work together, verifying the interactions, data flow, and communication between integrated parts to ensure they function properly as a collective. It sits after unit testing and before user acceptance testing, the phase where the product gets treated as a complete system for the first time.
This guide covers everything testers need to know, what SIT actually involves, how it works, where it fits in the development lifecycle, and how to run it effectively.
What Is System Integration Testing (SIT): Meaning, Definition, and Goals
At its core, SIT is about one thing: making sure the pieces actually work together. System Integration Testing is the overall testing of a whole system composed of many sub-systems, with the main objective of ensuring that all software module dependencies are functioning properly and that data integrity is preserved between distinct modules. Instead of retesting individual components, SIT tests what happens when those components start talking to each other.
Where SIT Sits in the Testing Lifecycle
SIT has a prerequisite in which multiple underlying integrated systems have already undergone and passed system testing. SIT then tests the required interactions between these systems as a whole, and its deliverables are passed on to user acceptance testing. Think of it as the bridge between verifying that individual parts work and confirming that the complete system is ready for real users.
What SIT Is Actually Testing
SIT isn’t a single type of test; it covers several dimensions of how integrated systems behave:
Interfaces and data flow: Does data move correctly between modules? Is anything getting lost, corrupted, or misrouted in transit?
Functional dependencies: When one module triggers an action in another, does the right thing happen?
Regression across integration points: As testing for dependencies between different components is a primary function of SIT, this area is often most subject to regression testing, confirming that recent changes haven’t broken existing connections.
Security and reliability: By testing how different components communicate and share data, SIT can uncover hidden vulnerabilities and security risks, helping to ensure the system is not just functional but secure and reliable.
The Goals of SIT
The goals of SIT go beyond finding bugs. Done well, it serves several purposes at once:
Confirming the system behaves as a unified whole, not just as a collection of individually passing components.
Catching integration defects, data mismatches, broken interfaces, and unexpected dependencies before they reach production.
Ensuring smooth business process changes, when companies update processes to meet new goals, those changes often affect multiple systems, and SIT helps make sure those updates are fully integrated and that everything still works correctly across all applications.
Giving the team confidence that what’s being handed off to UAT is actually stable.
Who Is Involved in SIT?
SIT isn’t a one-person job. Test managers or test leads plan the scope and goals, determine the approach and schedule, and define roles and responsibilities. From there, testers execute the test cases, developers address the defects that surface, and system architects provide the technical context needed to understand how components are supposed to interact. It’s a collaborative process, and it works best when everyone understands what they’re responsible for before testing starts.
Why System Integration Testing Matters
Unit tests passing across the board are reassuring. But it doesn’t tell you what happens when those units start working together, and that gap is where some of the most damaging defects hide. Here’s why SIT deserves more attention than it typically gets.
It Catches the Bugs That Unit Testing Misses
Integration testing identifies defects that are difficult to detect during unit testing and reveals functionality gaps between different software components prior to system testing. Individual components can behave perfectly in isolation and still fail the moment they need to exchange data or trigger actions across a boundary. Those are the defects that SIT is specifically designed to surface, and they’re exactly the kind that tend to be expensive when they reach production.
It Validates How the System Behaves End-to-End
SIT validates the end-to-end functionality of the system, simulating real-world scenarios to uncover any integration-related bugs or defects. This is the first point in the testing lifecycle where the product gets evaluated as a complete, working system rather than a set of independent components, which means it’s also the first point where real user journeys can be properly tested.
It Protects Against the Ripple Effect of Updates
In the era of Agile and DevOps, software vendors roll out frequent updates. If systems are tightly integrated, unexpected problems may occur in one component when another component receives updates. SIT acts as a safety net against that ripple effect, catching regressions at integration points before they quietly break something that was working fine last sprint.
It Keeps Business Processes Intact
Software doesn’t exist in a vacuum; it supports real business workflows. When organizations change existing business processes to accommodate new requirements, those changes may have interdependencies on different modules and applications. SIT fills in these gaps and ensures that new requirements are incorporated into the system. Without it, a change that looks clean on paper can quietly break a workflow nobody thought to test.
It Reduces the Cost of Late Defects
The later a defect is found, the more it costs, in engineering time, in rework, and in the knock-on effect it has on everything downstream. By identifying and resolving potential issues early, SIT prevents costly failures later in the development or production stages. Catching an integration defect during SIT is a fraction of the cost of catching it after release, and significantly less damaging to user trust.
It Supports Agile and Continuous Delivery
SIT is an essential testing phase in agile development methodologies, helping to ensure that the system is tested comprehensively and meets the specified requirements. In a world where teams are shipping continuously, having a reliable integration testing process isn’t optional; it’s what makes fast delivery sustainable rather than reckless.
Different Techniques of System Integration Testing
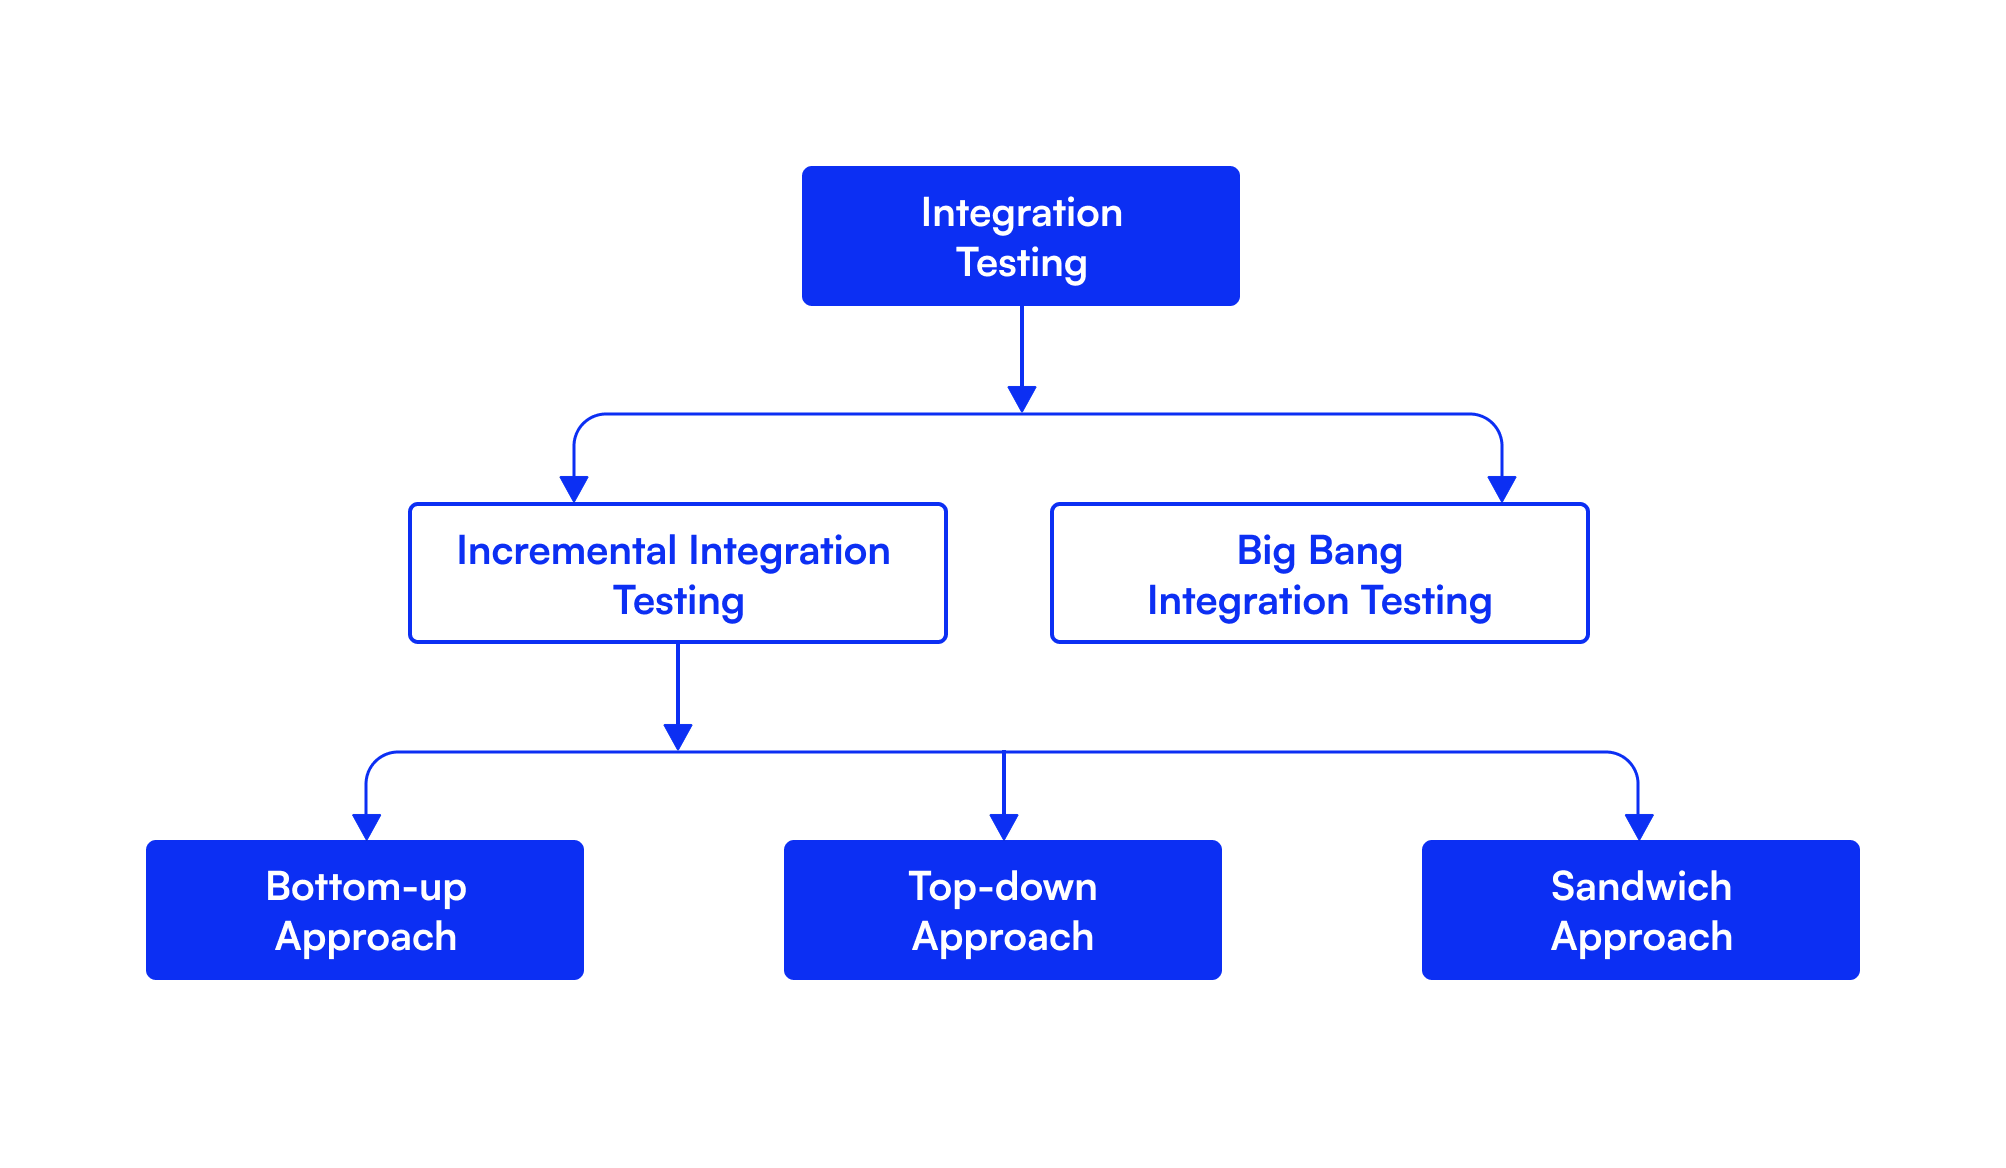
There’s no single way to run SIT. The right approach depends on your system’s architecture, how far along development is, and what kind of risk you’re most concerned about. Integration testing strategies broadly fall into two categories: non-incremental and incremental. Non-incremental approaches involve integrating all components at once, which can simplify planning but increase the risk of integration failures. Incremental approaches build the system piece by piece, making it easier to isolate defects.
Here’s how each technique works in practice.
Incremental Testing
Incremental testing is the backbone of most modern SIT approaches. Rather than waiting until every module is ready before testing begins, two or more components that are logically related are tested as a unit, then additional components are combined and tested together, repeating until all necessary components are covered. The key advantage is fault isolation; when something breaks, you know exactly which integration introduced the problem. It’s slower than throwing everything together at once, but significantly less painful to debug.
Bottom-Up Integration Testing
Bottom-up integration testing starts with the lower-level modules, which are tested first and then used to facilitate the testing of higher-level modules. The process continues until all modules at the top level have been tested. This approach uses drivers, temporary programs that simulate higher-level modules not yet available, to keep testing moving without waiting for the full system to be built. It’s particularly well-suited to data-heavy applications and microservices architectures where the foundation needs to be rock solid before anything else is layered on top. The tradeoff is that high-level functionality, the parts users actually interact with, gets validated last.
Top-Down Integration Testing
Top-down is essentially the reverse. Testing begins with the highest-level modules and works down through lower-level components, using stubs to simulate the behaviour of modules not yet integrated. This means user-facing functionality gets tested early, which makes it easier to catch design and flow issues before they’re baked in. The downside is that lower-level modules, often where the most critical business logic lives, get less thorough coverage until late in the process, and writing stubs for every missing module adds overhead.
Sandwich (Hybrid) Testing
Sandwich testing, also known as hybrid integration testing, is used when neither top-down nor bottom-up testing works well on its own. It combines both approaches, allowing teams to start testing from either the main module or the submodules, depending on what makes the most sense, instead of following a strict sequence. It uses both stubs and drivers, allows parallel testing across layers, and is particularly well-suited to large, complex systems. The tradeoff is cost and complexity; it takes more planning and more resources to run effectively, and it’s overkill for smaller projects.
Big Bang Integration Testing
Big bang is the simplest approach on paper and the riskiest in practice. All components or modules are integrated together at once and tested as a single unit, which means if any component isn’t complete, the entire integration process can’t execute. When it works, it works quickly and gives an immediate overview of system behaviour. When it doesn’t, it can’t reveal which individual parts are failing to work in unison, making debugging significantly harder. It’s best suited to small, simple systems where the complexity of incremental testing isn’t justified. For anything larger, the time saved upfront tends to get paid back with interest when defects surface.
The Role of QA in SIT
SIT is a team effort, but QA sits at the centre of it. While developers, architects, and business analysts all play a part, it’s the QA team that owns the process, from planning through to sign-off.
QA engineers create the detailed test cases and execute SIT, verifying that integrated components function correctly. System architects and developers work closely with QA to understand integration requirements and designs and support the creation of the testing environment. Business analysts collaborate with the QA team to ensure the integrated system aligns with business requirements and actively participate in reviewing and validating test cases.
In practice, that means QA is responsible for a lot more than just running tests. QA engineers develop and execute integration test cases, document defects correctly, and guide developers on fixes to make sure everything is resolved on time. They’re also the ones who decide when the system is stable enough to move forward, which makes their judgment and their test results critical to the process.
The broader point is this: quality in SIT isn’t the QA team’s responsibility alone, but without a strong QA function anchoring the process, integration defects have a reliable way of making it further than they should.
Entry and Exit Criteria for System Integration Testing
Before SIT begins and before it ends, there needs to be a clear agreement on what “ready” actually means. Entry and exit criteria are what provide that clarity; they define the conditions that must be met before testing starts and the conditions that must be satisfied before the team can move on. Without them, integration bugs have a reliable way of slipping through unnoticed.
Entry Criteria - Before SIT begins:
All individual components have completed unit testing successfully
The integration test environment is set up and available
Test data is prepared and sufficient to simulate real-world scenarios
The integration test plan and test cases have been reviewed and approved
Software requirements, design documents, and integration specs are available
All priority bugs from unit testing have been resolved
Roles and responsibilities across the testing team are clearly defined
Exit Criteria - Before SIT Is Signed Off:
All planned SIT test cases have been executed
All critical and high-priority defects have been fixed and closed
Test coverage meets the agreed threshold across all integration points
All test results, defects, and documentation have been updated and signed off on
Stakeholders have reviewed and approved the integration test results
The system is stable and ready to progress to system or acceptance testing
Treating these criteria as a formality or skipping them under deadline pressure is one of the more reliable ways to end up back at square one after something breaks in production.
Primary Benefits of SIT Testing
SIT is one of those phases that doesn’t always get the credit it deserves, until something goes wrong without it. Here’s what it actually delivers when done well:
Early detection of integration defects: Issues at component boundaries get caught before they compound. A data mismatch or broken API call found during SIT is a fraction of the cost of the same defect found in production.
End-to-end validation: SIT is the first point in the testing lifecycle where the system gets evaluated as a whole. It confirms that real user journeys work correctly across all integrated components, not just in isolation.
Reduced risk at release: By the time a system passes SIT, the team has evidence that it holds together under realistic conditions. That’s a meaningfully different level of confidence than unit tests alone provide.
Protection against regression: When updates are made to one component, SIT catches the unintended knock-on effects before they silently break something else that was working fine.
Better collaboration between teams: Running SIT forces developers, QA, and architects to align on how components are supposed to interact. That shared understanding tends to surface assumptions and miscommunications that would otherwise only become visible at the worst possible time.
Supports compliance and auditability: For teams in regulated industries, SIT provides a documented record of how integrated systems were tested and what was verified, which matters when audits happen.
Smoother handoff to UAT: A system that has passed SIT is cleaner, more stable, and better documented. That makes User Acceptance Testing faster and more focused on real user feedback rather than catching defects that should have been found earlier.
Common Challenges in SIT Testing
SIT is one of the more complex phases in the testing lifecycle, and not just technically. Here’s where teams most commonly run into trouble:
Integration complexity: Different systems may use different data formats, structures, or naming styles, which causes issues when data moves between them. The more systems involved, the more combinations there are for things to go wrong.
Managing dependencies: When one module isn’t ready, it holds up everything connected to it. Delays or bugs in one system can cause cascading issues throughout the integration, making it hard to keep testing on schedule.
Incomplete or unstable modules: One module may be incomplete or unstable, requiring stubs and drivers to simulate missing components and reduce testing delays.This adds overhead and introduces its own risk if the simulated behaviour doesn't accurately reflect the real thing.
Test environment complexity: Setting up and maintaining a consistent integration test environment is harder than it sounds. Configuration drift, when an environment gradually strays from its intended setup, can produce inaccurate results and make defects harder to trace.
Difficulty isolating failures: When multiple systems interact, it’s hard to trace failures back to their root cause. Without proper logging and monitoring in place, debugging integration defects becomes a time-consuming process of elimination.
Legacy system compatibility: Older systems built on outdated technologies often resist clean integration with modern applications. Mismatched data formats, deprecated APIs, and a lack of vendor support all add friction that newer systems don’t carry.
Keeping up with Agile and DevOps pace: Frequent updates in Agile and DevOps environments can cause issues in integrated systems. End-to-end regression testing is necessary but time-consuming and often inadequate when done manually.
Test coverage gaps: Creating test cases that cover all possible interactions and edge cases between integrated systems can be time-consuming and complex, and it’s easy to miss scenarios that only surface under specific conditions or at scale.
Best Practices for SIT
SIT is only as effective as the process behind it. Having the right techniques in place is one thing; executing them in a structured, disciplined way is what actually determines whether integration defects get caught before they cause problems. Here are the practices that make the biggest difference.
Set Well-Defined Objectives
Before a single test gets written, the team needs to agree on what SIT is actually trying to achieve. Clear goals help focus testing efforts, ensure comprehensive coverage, and facilitate early detection of integration issues. Without them, testing becomes broad and unfocused, teams end up covering some areas twice and missing others entirely. Define the scope, the integration points being tested, and what a successful outcome looks like before anything else.
Identify and Document Test Cases
Develop detailed test cases covering both positive and negative scenarios. This ensures all possible interactions and edge cases between integrated systems are validated thoroughly. Every test case should include the input data, expected outcome, and any dependencies. Maintaining all test assets, such as test scripts and results,s in a centralised location means all teams can easily access them, which matters more than it sounds when multiple teams are working across the same integration points simultaneously.
Create Accurate Test Data
Test data quality directly affects the reliability of SIT results. Specific expectations generate good test data, and this also positions you to automate basic regression tests and drive test harnesses. Test data should mirror real-world usage as closely as possible, covering typical scenarios as well as edge cases. Vague or generic test data produces vague results and makes it much harder to reproduce defects when they surface.
Implement Test Automation
Manual testing alone can’t keep up with the pace and volume that SIT demands. Automated testing can quickly execute test cases, while manual testing covers aspects of the integration that may be difficult to automate; combining both ensures that all aspects of the integration are thoroughly tested. Automation is particularly valuable at integration points that are touched frequently, where running tests manually after every change simply isn’t sustainable.
Track and Analyze System Performance
Functional correctness is only part of the picture. During testing, continuously track performance metrics to identify bottlenecks or degradation points caused by integration. A system can pass every functional test and still fall apart under load, slow response times, memory leaks, and throughput issues often only emerge when components are working together under realistic conditions. Catching these during SIT is significantly cheaper than catching them in production.
Record and Report Results
Keep detailed records of all executed tests, encountered defects, and resolutions. Well-documented results support transparency, assist debugging, and provide traceability for compliance and audits. Good documentation also protects the team when questions arise later about what was tested, what was found, and what was done about it. A result that isn’t recorded might as well not exist.
Re-Test After Fixes and Updates
Fixing a defect doesn’t mean the problem is fully solved, or that the fix didn’t introduce something new. After making changes, re-run relevant tests to confirm the fix works and nothing else broke. Continuous re-testing keeps the system stable as things change. Without it, a passing SIT can give a false sense of confidence.
System Integration Testing (SIT) With TestFiesta
SIT doesn’t exist in isolation; it sits inside a broader testing pyramid that spans unit testing, integration testing, system testing, and UAT. The challenge for most teams isn’t understanding that pyramid, it’s having the tools to support it end-to-end without stitching together multiple platforms to do it.
TestFiesta is built to support the full testing lifecycle, not just one phase of it. Test cases can be organized and executed across every level of the pyramid, from early unit and integration tests through to full system and acceptance testing, in one place.
For SIT specifically, that means the teams running integration tests are working in the same environment as the teams above and below them in the pyramid, keeping coverage visible and handoffs clean.
Managing SIT Without the Overhead
TestFiesta makes it straightforward to create and maintain test cases mapped directly to integration points, structured by feature, module, or risk level. Native defect tracking means issues get logged, assigned, and resolved without switching tools, keeping the feedback loop tight across what is often a highly collaborative, multi-team process. And when it comes to knowing whether the system is ready to move forward, the reporting gives a clear, evidence-based picture of coverage and defect status across all integration points, no manual dashboard updates required.
Native Jira and GitHub integrations mean defects flow directly into the development workflow without manual handoffs. Less friction, better visibility, and one less reason for things to fall through the cracks during one of the more complex phases in the testing lifecycle.
Conclusion
System integration testing is the phase where the real picture of software quality emerges. Unit tests tell you that individual components work. SIT tells you whether the system works, and that’s a meaningfully different question.
The teams that treat SIT as a formality tend to find out why it matters at the worst possible time. The ones that invest in it properly, clear entry and exit criteria, well-documented test cases, the right techniques for their architecture, and tooling that keeps everything connected, ship with a level of confidence that unit testing alone simply can’t provide.
The core takeaways are straightforward: start SIT with defined objectives and don’t skip the entry criteria, choose an integration technique that matches your system’s complexity, catch defects at integration points before they compound downstream, and make sure the entire process is documented well enough to stand up to scrutiny.
TestFiesta supports this process end-to-end, bringing test management, defect tracking, and reporting into one place so nothing falls through the cracks.
FAQs
What is SIT in testing?
System integration testing is the process of verifying that different software modules and systems work correctly together. It focuses on the interactions, data flow, and communication between integrated components, not on whether individual parts work in isolation, but on whether they work as a whole.
Who performs SIT testing?
SIT is primarily carried out by QA engineers, often working closely with developers and system architects. QA owns the test planning and execution, developers address defects as they surface, and architects provide the technical context needed to understand how components are supposed to interact.
Why do teams need to conduct SIT testing?
Because unit tests only confirm that individual components work, they can’t tell you what happens when those components start talking to each other. SIT is what catches data mismatches, broken interfaces, and unexpected dependencies before they reach production, where they’re significantly more expensive to fix.
What are the limitations of SIT?
SIT can be time-consuming and resource-intensive, especially for complex systems with many integration points. Setting up and maintaining a stable test environment is harder than it sounds, and when failures occur across multiple interacting components, tracing them back to their root cause isn’t always straightforward. It also relies on modules being reasonably stable before testing begins; unstable components slow the entire process down.
What is the difference between Integration Testing and System Integration Testing?
Integration testing focuses on testing the interfaces between interconnected modules, while system testing checks the application as a whole for compliance with both functional and non-functional requirements. In short, integration testing is about verifying that components connect correctly, while SIT takes a broader view, validating that the entire integrated system behaves as expected end-to-end.
Is SIT a black box testing technique?
Mostly, yes. SIT is predominantly conducted using black-box testing techniques; testers interact with the system through its interfaces without needing to know what’s happening in the underlying code. That said, some knowledge of system architecture is often useful for designing effective test cases, particularly when tracing failures across integration points.
Tool
Pricing
TestFiesta
Free user accounts available; $10 per active user per month for teams
TestRail
Professional: $40 per seat per month
Enterprise: $76 per seat per month (billed annually)
Xray
Free trial; Standard: $10 per month for the first 10 users (price increases after 10 users)
Advanced: $12 per month for the first 10 users (price increases after 10 users)
Zephyr
Free trial; Standard: ~$10 per month for first 10 users (price increases after 10 users)
Advanced: ~$15 per month for the first 10 users (price increases after 10 users)
Testing efforts vary from software to software, and in some cases, there is no right answer to what the correct system output is. The perfect examples are climate models predicting weather 50 years from now, a machine learning model ranking millions of search results, or an autonomous vehicle detecting objects in real time.
Testing efforts vary from software to software, and in some cases, there is no right answer to what the correct system output is. The perfect examples are climate models predicting weather 50 years from now, a machine learning model ranking millions of search results, or an autonomous vehicle detecting objects in real time.
How do you verify whether the system output is actually correct when nobody knows what the exact expected answer should be?
In software engineering, this challenge is known as the oracle problem; a bottleneck where traditional unit tests and pass/fail assertions hit a wall. When checking single outputs against fixed expected values is impossible or too expensive, metamorphic testing offers a powerful alternative: instead of checking whether a single output is correct on its own, you check how outputs relate across logical transformations of the input.
What Is Metamorphic Testing
Metamorphic testing is a way to test software without knowing the exact correct output for any single input. Instead of checking one result against an expected value, you run the program more than once with related inputs. Then you check that the outputs relate to each other the way they logically should.
Here is a simple illustration:
Say you are testing a payroll function. You may not know the exact total for a 400-person company with overtime, bonuses, and tax rules. But you do know one thing for sure: If every employee’s hourly rate doubles and nothing else changes, gross payroll should double too. Run both versions, compare, and if the second total isn’t twice the first, you can determine that the output is wrong. As a result, you found a problem without ever knowing the “right” answer.
Metamorphic testing has two main strengths:
It eases the oracle problem: You verify relationships between outputs, not the correctness of each output on its own.
It generates new tests: Every existing test case can spawn follow-up cases, so coverage grows from tests you already have.
What Is a Metamorphic Relation
A metamorphic relation (MR) is the rule that ties metamorphic test runs together. It states how a specific change to the input should affect the output. If the outputs break the rule, the program has a fault somewhere.
Every MR has two parts. One is the input transformation, which is how you change the original input to create a new one. The other is the output relation, which is what must hold between the original output and the new output.
Imagine you are testing a function that sorts a list of numbers. For a short list, you can check the result by looking at it. But for a list of 100,000 numbers, you need a function. When testing complex functions like sorting a massive list of numbers where you cannot manually verify every expected output, you can still rely on fundamental rules or properties that must always remain true. Each of these inherent properties serves as a Metamorphic Relation (MR) that can be used to catch software bugs without needing to know the exact final answer in advance.
In this specific case, the MRs would be:
MR 1: Shuffling the input should not change the output. If list B contains exactly the same numbers as list A in a different order, then sort(B) must equal sort(A). If they differ, the function is mishandling order somewhere.
MR 2: Adding a larger number should only extend the output. If you append a value bigger than everything in list A, the sorted result should be the original sorted list with that value at the end. Anything else means the new element disturbed items it never should have touched.
Neither rule tells you what the sorted list should look like. But both can still catch real bugs. Mathematical functions work the same way. You may not know sin(x) to fifteen decimal places, but you know sin(x) and sin(π − x) must be equal.
How Metamorphic Testing Works: A Step-by-Step Guide
Metamorphic testing follows the five steps, which remain the same regardless of testing a sort function or a self-driving model.
To make it simple, we’ll use the e-commerce search example.
Step 1: Identify metamorphic relations: Study what the system is supposed to do and write down properties that must hold across related inputs, like “adding a filter never adds results.” This step takes the most thought and depends on domain knowledge, so pull in the people who understand the system best.
Step 2: Create source test cases. Choose the original inputs the process starts from, such as a set of real search queries. These can be existing test cases, randomly generated inputs, or anonymized production data.
Step 3: Derive follow-up test cases. Apply each MR’s input transformation to every source case, such as by adding a size filter to each query. One source case can feed several MRs, so a small seed set grows quickly.
Step 4: Execute both sets. Run the program on the source inputs and the follow-up inputs, then record every output. Keep each follow-up paired with its source so you always know which results to compare.
Step 5: Verify the relation. Check whether each pair of outputs satisfies the output relation, such as “filtered results are a subset of unfiltered results.” A violation means at least one output is wrong, which signals a bug in the program or a flaw in the MR itself.
A Pro Tip: A passing metamorphic test does not prove the program is correct. A function could break in a way that still satisfies a given relation. That is why teams usually define several MRs per feature, each checking the behavior from a different angle.
Where Metamorphic Testing Matters
Metamorphic testing matters wherever expected outputs are unknown, expensive to compute, or open to interpretation. These five areas are where it shows up most include:
Scientific and mathematical software
Simulations and numerical programs that often have no known exact answer to compare against.
Mathematical properties like symmetry, scaling, and conservation laws.
Published studies have applied it to bioinformatics programs, epidemiological models, and software at NASA.
Machine learning and AI models
Models that produce outputs that no one can fully specify in advance, which is the oracle problem in its purest form.
Machine learning models where output should remain consistent or stable when minor, non-essential changes are made to the input. In this context, if you slightly darken a photo, an image classifier should still recognize the same object, because a minor change in lighting doesn’t change the underlying subject of the image.
Large language models where rephrasing a factual question should not change the factual answer.
Search engines and ranking systems
Systems where there is no objective, agreed-upon “correct” result set for most queries.
Subset and consistency relations, like the filtering examples.
Compilers and code translation tools
Tools where verifying the compiled output for every possible program is out of reach.
Translation tools where two programs that behave the same on a given input should still behave the same after compilation.
Web APIs
API responses that often depend on live, constantly changing data, so exact expected values are hard to pin down.
How TestFiesta Helps With Test Case Management for Metamorphic Testing
Metamorphic testing multiplies your test cases fast. Five MRs applied to 40 source cases give you 200 follow-up cases, and every one of them needs to stay linked to its source, its relation, and its result. Without structure, that turns into a cluttered dashboard or spreadsheet.
TestFiesta keeps everything around them organized and traceable.
Customizable Tags:TestFiesta offers unlimited customizable tags for grouping, filtering, and sorting test cases. Tag each case with its MR and its role as a source or follow-up case. When an MR starts failing, you can filter straight to every related case.
Custom Fields: Custom fields capture data at the test case, run, or result level. Use them to record the input transformation, the expected output relation, and the ID of the source case each follow-up came from.
Reusable Templates: Build one MR template with fields for the transformation and the relation. Every new MR then gets documented the same way, no matter who on the team writes it.
Shared Steps: Source and follow-up cases usually share setup, like loading a dataset or authenticating against an API. Write those steps once and reuse them everywhere, so a change in setup updates every case at once.
Configurations: Configurations let you reuse one test case across many setups. Run the same MR against different environments, browsers, or model versions without cloning cases.
Jira and GitHub Integrations: When a relation is violated, turn the failed test into a Jira or GitHub issue with full context, or log bugs natively in TestFiesta. Developers see both inputs and both outputs, which is exactly what they need to debug a metamorphic failure.
An API for Automated Results: Metamorphic tests are usually automated, and TestFiesta’s Automation API supports custom automations, so results from your test runs can flow into the platform instead of being copied by hand.
Don’t let the complexity of managing metamorphic relations and automated test suites slow down your release cycles.
Yes, metamorphic testing can be automated, and it is well-suited to automation. Once your MRs are defined, generating follow-up inputs, running both sets, and checking the relations can all be scripted.
What tools do I need for metamorphic testing?
You don’t need a dedicated tool for metamorphic testing. Most teams write MRs as ordinary tests in the framework they already use, such as pytest or JUnit, and property-based testing libraries like Hypothesis can help generate source inputs. A test case management platform keeps your MRs, source cases, follow-ups, and results connected as the suite grows.
Do I need to know the correct output to write metamorphic tests?
No, you don’t need to know the correct output to write metamorphic tests. That’s the entire point of metamorphic testing. You only need to know how outputs should relate to each other when the input changes in a specific way. Writing good relations still takes domain knowledge, but you never need the exact expected value for any single input.
Testing guide
October 7, 2026
Testing guide
Best practices
What Is a Testing Matrix: Types, Uses, and Examples
Testing everything might be a simple job for QA leads, but keeping track of test cases and their pass-fail rate is more complicated than it seems. In outdated teams, test cases live in one place, requirements in another, bug reports in a third, and the burden of connecting them all usually falls on a single person. A testing matrix fixes that.
Testing everything might be a simple job for QA leads, but keeping track of test cases and their pass-fail rate is more complicated than it seems. In outdated teams, test cases live in one place, requirements in another, bug reports in a third, and the burden of connecting them all usually falls on a single person. A testing matrix fixes that.
A testing matrix puts your tests, requirements, environments, and results in one view so anyone on the team can see what has been covered, what has been run, and what is still missing.
What Is a Testing Matrix
A testing matrix is a grid that maps one set of testing elements against another. Rows usually hold test cases. Columns hold whatever you need to check those tests against, such as requirements, features, browsers, risk levels, or execution status.
Each cell where a row and column meet tells you something specific, such as which test covers which requirement.
Keep in Mind: The terms “testing matrix” and “matrix testing” are often used interchangeably, but they mean different things. Matrix testing refers to running the same set of tests across every combination of configurations, such as multiple operating systems and runtime versions. The terms are used interchangeably because of the ability to view the test cases in a matrix.
Here is a simple example of a testing matrix:
Test Case ID
Requirement
Chrome
Firefox
Safari
Status
TC-001
User can log in with email
Pass
Pass
Pass
Pass
TC-002
User can reset password
Pass
Fail
Not run
Fail
TC-003
User can log out
Not run
Not run
Not run
Not run
In three rows, you can already see a failure on Firefox, an untested browser for password reset, and a logout flow nobody has touched. That is the whole point of a testing matrix. It turns scattered information into something you can read in seconds.
Teams use testing matrices to:
Confirm every requirement has at least one test behind it
Spot gaps before a release instead of after it
Show stakeholders where testing stands without a long status meeting
Keep an evidence trail for audits and client sign-offs
The 6 Types of Testing Matrices and When to Use Each
Not every matrix answers the same question. Some prove coverage, some track progress, and some help you decide what to test first. Here are the six most common types and the situations each one fits:
1. Requirement Traceability Matrix (RTM)
An RTM links each requirement to the test cases that verify it, and often to any defects found along the way. It answers one question clearly: is every requirement tested?
Traceability can run in three directions. Forward traceability goes from requirements to tests, so you know each requirement is covered. Backward traceability goes from tests to requirements, so you know every test exists for a reason. Bidirectional traceability does both.
Requirement ID
Requirement
Test Cases
Defects
Status
REQ-01
Users can sign up with Google
TC-101, TC-102
None
Pass
REQ-02
Passwords must be 8+ characters
TC-103
BUG-45
Fail
REQ-03
Users can delete their account
None
None
Not covered.
When to Use RTM: Projects with formal requirements, client sign-offs, or regulatory oversight. It is also useful any time scope changes mid-project, and you need to see which tests are affected.
2. Test Coverage Matrix
A test coverage matrix shows how thoroughly each feature or module is tested, usually broken down by test type. Where an RTM asks “is this requirement tested at all,” a coverage matrix asks “how well is this area tested, and in which ways?”
Feature
Unit
Integration
API
UI
Performance
Checkout
Yes
Yes
Yes
Yes
No
Search
Yes
No
Yes
Yes
No
User profile
Yes
Yes
No
No
No
When to Use Test Coverage Matrix: Planning a test strategy, deciding where to add automation, or reviewing whether high-traffic features are getting enough attention.
3. Test Progress Matrix
A test progress matrix tracks execution during a test cycle. It shows how many tests are planned, executed, passed, failed, or blocked, typically grouped by module, sprint, or tester.
Module
Planned
Executed
Passed
Failed
Blocked
Payments
40
32
28
3
1
Onboarding
25
25
24
1
0
Reports
30
12
12
0
0
When to Use Test Progress Matrix: Daily standups, sprint reviews, and go or no-go release meetings. It gives managers a status update without anyone writing one.
4. Risk-Based Testing Matrix
A risk-based testing matrix ranks features by two factors: how likely they are to fail and how much damage a failure would cause. Multiplying or combining the two gives each area a risk level, which tells you where to spend testing time first.
Feature
Likelihood of Failure
Business Impact
Risk Level
Testing Priority
Payment processing
Medium
High
High
Test first, full regression
New dashboard widget
High
Medium
High
Test first
Footer links
Low
Low
Low
Spot check
When to Use Risk-Based Testing Matrix: Tight deadlines, large regression suites you cannot run in full, or newly built features with little test history.
5. Environment Compatibility Matrix
An environment compatibility matrix maps test cases against the browsers, operating systems, devices, and versions your product supports. It confirms the product works the same way across all devices, operating systems, and browsers.
Test Case
Chrome / Windows
Safari / macOS
Safari / iOS
Chrome / Android
Login
Pass
Pass
Pass
Pass
File upload
Pass
Pass
Fail
Pass
Dark mode
Pass
Not run
Not run
Pass
The number of combinations grows fast. Five browsers, three operating systems, and four screen sizes already give you 60 configurations. Many teams use pairwise testing, a technique that covers every pair of values at least once, to cut that number down without losing much coverage.
When to Use Environment Compatibility Matrix: Customer-facing web and mobile apps, cross-platform releases, and products with users on older devices. It’s most often used in cross-browser testing.
6. Compliance Coverage Matrix
A compliance coverage matrix maps regulatory or internal policy controls to the tests and evidence that prove they are met. Think of it as an RTM where the requirements come from a standard or regulation instead of a product spec.
Control
Description
Test Cases
Evidence
Status
AC-01
Only admins can export user data
TC-301, TC-302
Test run report, screenshots
Pass
LOG-02
All login attempts are logged
TC-310
Log sample
Pass
ENC-03
Stored passwords are hashed
TC-320
None yet
Not run
When to Use Compliance Coverage Matrix: Products in regulated industries like healthcare and finance, or teams preparing for audits under frameworks such as SOC 2, HIPAA, or PCI DSS.
What Goes Inside a Testing Matrix
The columns you choose decide what your matrix can tell you. Start small, then add detail only when the project needs it. A matrix with 20 columns that nobody updates is worse than one with five that stay accurate.
Core Columns Most Teams Start With
Test Case ID: A unique identifier for each test, such as TC-001. It lets you reference a test in bug reports, standups, and other matrices without describing it every time.
Requirement or Feature: The requirement, user story, or feature the test verifies. This is the link that turns a list of tests into a traceability tool.
Test Scenario: A short description of what the test checks, written so anyone on the team understands it. “User resets password using an expired link” is clearer than “Password test 3.”
Test Status: The current result of the test. Most teams use a small, fixed set of values like Not Run, Pass, Fail, Blocked, and Skipped. Keep the list short and consistent so filters and reports stay reliable.
Optional Columns That Add Depth
As projects grow, four core columns stop being enough. These are the most common additions:
Test Data:Test data is the inputs a test needs, such as a specific user account, a sample file, or a card number from a test payment provider. Recording it makes tests repeatable for whoever runs them next.
Execution Environment. Execution environment is where the test ran, like a browser, operating system, device, build version, or server environment like staging or production. Without it, a “Pass” result can be misleading.
Defect ID: Defect ID is the bug ticket linked to a failed test. It connects your matrix to your issue tracker so developers can jump straight from a failure to its fix.
Priority and Severity: Priority tells you how soon something should be tested or fixed. Severity tells you how badly a failure affects users. Keeping them separate helps, since a typo on the homepage can be low severity but high priority.
Assigned Tester: A tester is the person responsible for running the test. It makes ownership clear and helps balance workload across the team.
Add these columns when the project calls for them, such as more testers, more environments, or stricter reporting needs. Adding them on day one usually leads to empty cells and ignored fields.
How to Build a Testing Matrix From Scratch
You do not need a special template to get started. The steps below work whether you are building your first matrix or cleaning up one that has grown out of control. To keep things concrete, we will follow one example: the checkout flow of an online store.
Step 1: Define What You Are Mapping
Decide what question the matrix should answer. Are you proving every requirement is tested? Checking browser support? Prioritizing by risk? Your answer decides your columns.
You can combine goals, but do it on purpose. For the checkout example, we want to map requirements to tests and track results across two browsers. That is an RTM with environment columns added.
Step 2: Collect and List All Test Cases With Unique IDs
Gather every test that touches the area you are mapping, including manual tests, automated tests, and the ones sitting in someone's personal notes. Give each one a unique ID and a clear scenario name.
For checkout, that might look like TC-201 “Guest user completes purchase,” TC-202 “Discount code applies correctly,” and TC-203 “Expired card is declined.”
Step 3: Map Each Test Case to Its Requirement or Feature
Link every test to the requirement or feature it verifies. One test can cover more than one requirement, and one requirement can need several tests. Record both directions.
If a test does not map to any requirement, ask why it exists. It may be testing something that was never written down, or it may be outdated and ready to retire.
Step 4: Add Environment and Execution Data Columns
Now add the columns your project actually needs. For checkout, we add Chrome and Safari columns, a Test Data column for the test card numbers, and an Assigned Tester column.
Test Case ID
Requirement
Test Data
Chrome
Safari
Tester
TC-201
REQ-10: Guest checkout
Guest email, test Visa
Not run
Not run
Sara
TC-202
REQ-11: Discount codes
Code SAVE10
Not run
Not run
Omar
TC-203
REQ-12: Card validation
Expired test card
Not run
Not run
Sara
Step 5: Assign Status Fields and Update Them as Tests Run
Set a status value for every test and environment pair before testing starts, even if it is just Not Run. Then update the matrix as each test is executed, not at the end of the day or the end of the sprint.
A matrix is only useful when it reflects reality. The moment results lag behind, people stop trusting it and go back to asking around in chat.
Step 6: Review for Gaps
Once the matrix is filled in, scan it for empty spaces. Any requirement with no linked test case is a coverage hole. Any test that has not run in a key environment is a blind spot.
In our example, suppose REQ-13 “Order confirmation email is sent” has no test linked to it. That gap is easy to miss in a list of test cases, but impossible to miss in a matrix. Write the test, link it, and run it before release.
Repeat this review whenever requirements change, new features land, or a release date gets close.
How TestFiesta Turns Your Testing Matrix Into a Living QA Asset
Most testing matrices start in a spreadsheet, which works for a while. But when your project grows, you need more structure, clarity, transparency, and traceability. That’s where TestFiesta can help.
TestFiesta is a test management platform built to keep all your test management information connected and updated in one place. Instead of maintaining a matrix by hand, you build it from the test data your team already works with every day.
Custom Fields: Need a column for risk level, browser, compliance control, or test data? Add it as a custom field. Your matrix holds exactly the information your team needs, without forcing every project into the same template.
Flexible Tagging: Tag test cases by requirement, feature, risk, or regulation, then filter by those tags. The same test library can serve as an RTM, a coverage matrix, or a compliance matrix, depending on what you need to see.
Test Runs Tracking: Results are recorded as your team executes tests, so progress reflects what has actually happened. No one has to copy results from one place into another at the end of the day.
Built-In Defect Tracking and Native Jira and GitHub Integrations: When a test fails, you can link the defect directly to the failed test case. Your Defect ID column points to real tickets, and developers can trace a bug back to the exact test that caught it.
Comprehensive Reports and Customizable Dashboards: Customizable dashboards and reporting give leads and stakeholders a live view of test progress, so a test progress matrix is always one click away.
Audit Trails Support Compliance Work: For teams building compliance coverage matrices, audit trails and granular access controls help show who ran what and when.
What’s the difference between a testing matrix and a test plan?
A test plan describes the strategy, including scope, approach, schedule, resources, and entry and exit criteria. A testing matrix is a working tool that maps tests to requirements, environments, or results.
Can I use a single testing matrix for multiple types of testing?
Yes, you can use a single testing matrix for multiple types of testing, as long as it stays readable. Many teams combine an RTM with environment or status columns in one view. Once a matrix gets too wide to scan, split it by purpose or use a tool that lets you filter one set of tests into different views.
How often should a testing matrix be updated during a project?
Update your testing matrix whenever something changes, like a test runs, a requirement is added or modified, or a defect is logged or closed. During active test cycles, changes usually occur daily. A matrix shouldn’t lag behind actual progress.
What is the difference between a testing matrix and matrix testing?
A testing matrix is a grid used to map and track test cases, requirements, and results, whereas matrix testing refers to the practice of executing the same set of tests across every combination of configurations (such as multiple operating systems, devices, or runtime versions).
Testing guide
Best practices
October 2, 2026
Testing guide
Natural Language Inference Testing
Artificial intelligence and large language models are not always accurate, but high accuracy benchmarks on flagship models can create a false sense of security, masking critical vulnerabilities that surface only when models encounter real-world complexity.
Artificial intelligence and large language models are not always accurate, but high accuracy benchmarks on flagship models can create a false sense of security, masking critical vulnerabilities that surface only when models encounter real-world complexity.
For instance, a model score of 91% on a benchmark makes it trustworthy, but that model can still take the error “payment not process” as “payment process,” which is detrimental to your system.
Natural Language Inference (NLI) testing provides a vital framework to bridge this gap, ensuring that systems truly understand semantic relationships, such as entailment, contradiction, and neutrality, rather than relying on superficial shortcuts.
This guide explores the foundational principles of NLI, its critical applications across modern software architectures, and practical strategies for building rigorous test suites that safeguard model performance in production environments.
What Is Natural Language Inference (NLI)
Natural Language Inference (NLI), also known as Recognizing Textual Entailment (RTE), is a fundamental problem in Natural Language Processing (NLP) that evaluates whether a given hypothesis logically follows from a given premise. It serves as a benchmark for measuring how effectively artificial intelligence models comprehend semantic context, reasoning, and textual relationships.
You give a model a premise (a statement taken as true) and a hypothesis (a statement to evaluate), and it returns one of three labels:
1. Entailment: If the premise is true, the hypothesis must also be true.
Premise: “The team shipped the release on Friday.”
Hypothesis: “The release shipped.”
2. Contradiction: If the premise is true, the hypothesis cannot be true.
Premise: “The team shipped the release on Friday.”
Hypothesis: “The release has not shipped yet.”
Neutral: The premise neither confirms nor rules out the hypothesis.
Premise: “The team shipped the release on Friday.”
Hypothesis: “The release had no bugs.”
These labels look simple enough to get right on the first go, but the problem is that the models often learn shortcuts that produce the right label, and the shortcuts often break the moment real users type something that the model didn’t train for.
Where NLI Shows Up in Real Software Systems
Natural language inference is pretty common across most AI systems in use today.
Hallucination detection in LLMs
When an LLM answers a question using retrieved documents, you want to know if the answer is actually supported by those documents. A common approach is to treat the source text as the premise and each claim in the generated answer as a hypothesis. If a claim is not entailed by the source, it gets flagged as a possible hallucination. The quality of your hallucination checks is only as good as the NLI model making those calls.
Chatbot and virtual assistant QA
Support bots and assistants need to stay consistent with policy documents, product specs, and their own earlier replies. NLI can check whether a bot’s response contradicts the refund policy or something it told the same user three messages ago. If the NLI layer misreads negation or numbers, the bot can confidently say the opposite of the policy and your checks will wave it through.
Document consistency checking
Contracts, technical documentation, and generated summaries all need to agree with their sources. How you chunk text changes how the NLI model behaves, so chunking strategy belongs in your test plan.
Zero-shot classification
Zero-shot classification is a method that treats the text you want to classify as the premise and builds a hypothesis from each candidate label, such as “This text is about politics.” Many zero-shot classification pipelines are NLI-based pipelines where classes can be chosen at runtime instead of being hardcoded. If your ticket router or content tagger uses zero-shot classification, you have an NLI model in production.
Fact verification pipelines
Fact-checking systems compare a claim against evidence and decide whether the evidence supports it, refutes it, or doesn’t say enough. That maps directly onto entailment, contradiction, and neutral.
What Is Natural Language Inference (NLI) Testing
NLI testing is the practice of systematically checking whether an NLI model (or any system that depends on one) produces the correct relationship label across the kinds of inputs it will see in production.
It goes beyond running a benchmark and reading off an accuracy score. Accuracy tells you how often the model agreed with a fixed dataset, but it doens’t anticipate the model’s reasoning capabilities for input that the model isn’t being trained for. Natural language inference testing checks for failures to prevent false accuracy.
What Makes NLI Testing Different from Regular Software Testing
NLI testing is very different from other forms of QA in various ways.
There’s often no single correct answer: Two people can read the same premise and hypothesis and disagree on the label, so there’s no single right answer.
The system isn’t built from readable rules: You can’t open the model and read the logic for handling “not.” Behavior comes from training data, so you learn what the model does by probing it with inputs, not by reviewing code.
Small input changes can cause big output changes: Swapping one word, adding an irrelevant sentence, or changing a date format can flip a label. Regular software rarely behaves this way, so edge cases in NLI are everywhere.
Results can be probabilistic: Many NLI models return confidence scores, and many teams apply a threshold to turn scores into labels. But a model update can shift scores just enough to change outcomes near that threshold, even when top-line accuracy barely moves.
Aggregate metrics hide the failures that matter: Held-out accuracy tends to overstate how good NLP models really are, and reducing performance to one aggregate number makes it hard to see where a model fails and how to fix it.
The good news is that most of the hurdles in NLI testing can be fixed borrowed from traditional QA: break behavior into capabilities, write targeted test cases for each, and track results over time.
How to Build a Natural Language Inference (NLI) Testing Test Suite
A solid NLI test suite has three layers: behavioral tests that probe specific reasoning skills, metamorphic tests for cases where you don’t have a known answer, and a regression set that protects you every time the model or prompt changes. Let’s see these layers in detail:
1. Start with Behavioral Test Categories
Behavioral tests work like unit tests for language skills. Behavioral testing frameworks often call these Minimum Functionality tests, which are modeled on software unit tests and consist of small sets of simple labeled examples that check one behavior. These are especially good at catching models that use shortcuts on complex inputs without really having the underlying skill.
Group your test cases by capability so a failure tells you exactly what broke. These five categories are a strong starting point:
Negation tests: Does the model correctly handle “not,” “never,” and “no longer”? Pair “The account is active” with “The account is not active” and expect contradiction. Then try harder versions, like “The account is no longer inactive,” where a double negative should lead to entailment.
Antonym tests: Does swapping a word for its opposite correctly flip the label? “The server response was fast” against “The server response was slow” should be contradiction. If the model calls it neutral or entailment, it is leaning on surface similarity instead of meaning.
Word overlap tests: Does high lexical similarity between premise and hypothesis bias the model toward entailment even when the logic doesn’t hold? This is the lexical overlap problem. Write pairs that reuse the same words with roles reversed, like “The manager approved the intern’s request” and “The intern approved the manager’s request,” and expect the model not to call it entailment.
Numerical reasoning tests: Does the model correctly infer that “finished in 3 hours” entails “took less than a day”? Include unit conversions, comparisons (“more than,” “at least”), and counts. Numbers are common in support, billing, and SLA content, so failures here have direct business impact.
Length mismatch tests: Does a very short hypothesis against a long premise perform differently than matched lengths? Take a hypothesis the model gets right against a one-sentence premise, then bury the same supporting fact inside a long paragraph. If accuracy drops, you have a real risk for any RAG or document-checking use case, where premises are rarely short.
For each category, write test cases covering all three labels, not just the one you expect to break. A negation suite made entirely of contradiction examples can pass even if the model has simply learned “negation word present means contradiction.”
AI evaluation researchers actually spotted this pattern in standard NLI benchmark datasets. Instead of learning to reason past the overlap heuristic, a model could just learn to predict contradiction whenever the premise has a negation and the hypothesis doesn’t.
2. Use Metamorphic Testing When You Don’t Have an Oracle
Hand-labeling thousands of premise and hypothesis pairs is slow and expensive. Metamorphic testing gets around this. Instead of checking an output against a known correct answer, you check whether the relationship between two outputs holds.
Behavioral testing methodologies include two test types built on this idea. Invariance tests apply changes that shouldn’t affect the label and expect the prediction to stay the same, while directional expectation tests expect the label to change in a specific way.
In practice, you can take any premise and hypothesis pair (even an unlabeled one from production logs) and apply transformations with a predictable effect like:
Paraphrase the premise: Rewording “The meeting was moved to Tuesday” as “They rescheduled the meeting for Tuesday” should not change the label.
Add irrelevant content: Appending “The office has a new coffee machine” to the premise should not change the label. If it does, your model is distracted by noise, which matters a lot in long documents.
Swap names or entities: Replacing “Sarah” with “Jenny” or “Acme Corp” with “Globex” should not change the label. If it does, you may also have a bias problem worth escalating.
Negate the hypothesis: If the original pair was entailment, negating the hypothesis should usually produce contradiction. A directional test is: you don’t need to know the right answer upfront, only how it should move.
Swap premise and hypothesis: Entailment is one-directional. “She bought a red car” entails “She bought a car,” but not the other way around. If a model gives the same entailment score in both directions, it is likely matching words rather than reasoning.
Metamorphic tests scale well because you can generate them automatically from real traffic. They turn your production data into a steady source of test cases without a labeling team.
3. Build a Minimum Viable Regression Set
Behavioral and metamorphic tests help you understand a model. A regression set protects you when things change. NLI systems change more often than teams expect, such as during models upgrades, prompt edits, threshold adjustments, and changes to how documents get chunked, which can all shift behavior.
Your minimum viable regression set should include:
A small golden set per capability: Pick a manageable number of high-confidence, clearly labeled cases from each behavioral category. Keep them unambiguous so a failure always means something.
Every production bug you’ve fixed: When a user reports that the bot misread “no longer available” or the hallucination checker missed a wrong date, turn that case into a permanent regression test. This is the same discipline you apply to regular software bugs.
Boundary cases near your threshold: If you convert confidence scores into labels, keep examples that sit close to the cutoff. These are the first to flip when the model changes.
Pass criteria per category, not just overall: An overall pass rate of 95% can hide a negation category that dropped from 90% to 60%. Set and track targets for each capability separately.
Run this set on every model, prompt, or pipeline change, and store results over time. The trend matters as much as any single run. A slow slide in numerical reasoning across three releases is something you want to catch at release one, not release four.
Why TestFiesta Belongs in Every Team’s NLI Testing Stack
NLI testing generates massive, complex datasets, from capability suites and golden sets to metamorphic transformations and multi-model regression runs. Spreadsheets and outdated legacy tools quickly fail under this complexity, making structured test management essential for reliable AI QA.
TestFiesta provides the precise infrastructure needed to manage, scale, and automate NLI testing workflows effectively:
Capability-Based Tagging: Tag test cases by reasoning capability (negation, antonyms, numerical logic) and target label. Filter and report instantly to isolate exact failure modes when models regress.
Structured Data Fields: Store premises, hypotheses, and expected relationship labels as structured Custom Fields rather than unformatted text block descriptions.
Multi-Model Configurations: Run a single test suite across multiple model variants, prompt updates, and confidence thresholds without duplicating test cases.
Automated Pipeline Integration: Ingest automated metamorphic and regression run results via CLI across 22 frameworks and 5 CI/CD platforms, unifying manual reviews and automated runs in one dashboard.
Early Instability & Flakiness Detection: Track execution trends and detect flaky tests automatically, crucial for catching probabilistic shifts near confidence thresholds before deployment.
Seamless Defect Tracking: Link failed NLI tests directly to built-in or mainstream issue trackers with full context, ensuring engineering teams can instantly reproduce and fix model failures.
Predictable Scaling: Access complete enterprise test management features with simple, transparent pricing designed to scale effortlessly with your team.
Ready to Supercharge Your NLI Testing?
Get structured test management infrastructure designed to scale behavioral, metamorphic, and regression testing with TestFiesta.
Yes, you can use an NLI model to test another NLI model, but treat it as a signal, not ground truth. Comparing two models is useful for finding disagreements, and those disagreements are great candidates for human review. The risk is that both models may share the same shortcuts, such as the lexical overlap heuristic, and confidently agree on the wrong answer.
How do I handle NLI test cases where the “correct” label is genuinely ambiguous?
Your first step to handling NLI test cases where the “correct” label is genuinely ambiguous is to accept that ambiguity is real and common. That is why human disagreement is so common in NLI testing. Keep ambiguous cases out of pass/fail regression suites, tag them separately, and review them manually or score them against the spread of human judgments. Pass/fail tests should only use cases your reviewers agree on.
Testing guide
Ready for a Platform that Works
The Way You Do?
Stop fighting your tools. Start shipping with confidence. TestFiesta adapts to your workflow, not the other way around.

_%20A%20Guide%20for%20Testers%20-%20Main%20Image.png)