
Back to Blog
Testing guide

What Is Test Case Management: Full Guide + Benefits & Steps

Learn what test case management is, how it works, and why it’s beneficial for QA teams. Explore a detailed buyer’s guide for the right test management tool.

Armish Shah
December 4, 2025
September 4, 2026
What Is Test Case Management: Full Guide + Benefits & Steps

Testing guide

What Is Test Case Management: Full Guide + Benefits & Steps

by:

Armish Shah

September 4, 2026

8

min

Share:

What Is Test Case Management: Full Guide + Benefits & Steps | TestFiesta
On this page

Ready to take your testing to
the next level?

Sleek and intuitive workflows
Transparent pricing
Easy migration

Introduction

From the minute you start writing software, you start testing it. Good code goes to waste if it doesn't fulfill its intended purpose. Even a “hello, world” needs testing to make sure that it does its job. As your software grows in complexity and gets deeper, your testing must keep up. That's where test case management comes in. In this detailed guide, we'll dive into what test case management is, what it looks like in practice, and how to choose the right tool that makes things easier on the testing side.

What Is Test Case Management

Test case management is the practice of creating, organizing, and maintaining test cases throughout the software development lifecycle. It includes writing test cases based on software requirements, grouping them into test suites, executing them across different releases, and tracking results over time. To manage this effectively, teams also need a clear understanding of the difference between test plans and test cases and how each document fits into the overall testing process. This practice keeps all your testing organized in one place. Instead of hunting through different cases manually, your team can instantly see what needs to be checked and what's already been verified. As your product evolves, your testing dashboard stays updated and accessible to everyone who needs it.

What Is a Test Case Management System

A test case management system is a platform that facilitates your test management. It’s designed to create, execute, and monitor test cases in real-time, providing a centralized workspace for QA teams to prepare the software for deployment. Good test management platforms work alongside the tools your team uses every day. Using a test management system, teams can create, organize, assign, and execute large amounts of test cases with ease. And when something breaks during testing, you can flag it immediately without jumping between tools or re-typing details. At the end of the day, you can log in and out of this tool, and all your testing progress remains in the same place.

How Does Test Case Management Work

Rigorous testing translates into fully-functional software products. This is especially true if you have a layered product with extensive usability, which calls for creating and managing test cases without any hindrance. Here’s how it works in practice:

Define Requirements

Test case management begins with a thorough understanding of what you're building. During this phase, QA teams collaborate with product owners, developers, and stakeholders to gather functional specifications, user stories, acceptance criteria, and technical documentation. Think of this phase as a foundation to a multi-story building; you want to make it as strong as possible. Without clear requirements, testing becomes guesswork, which is never a good call. 

Create Test Cases

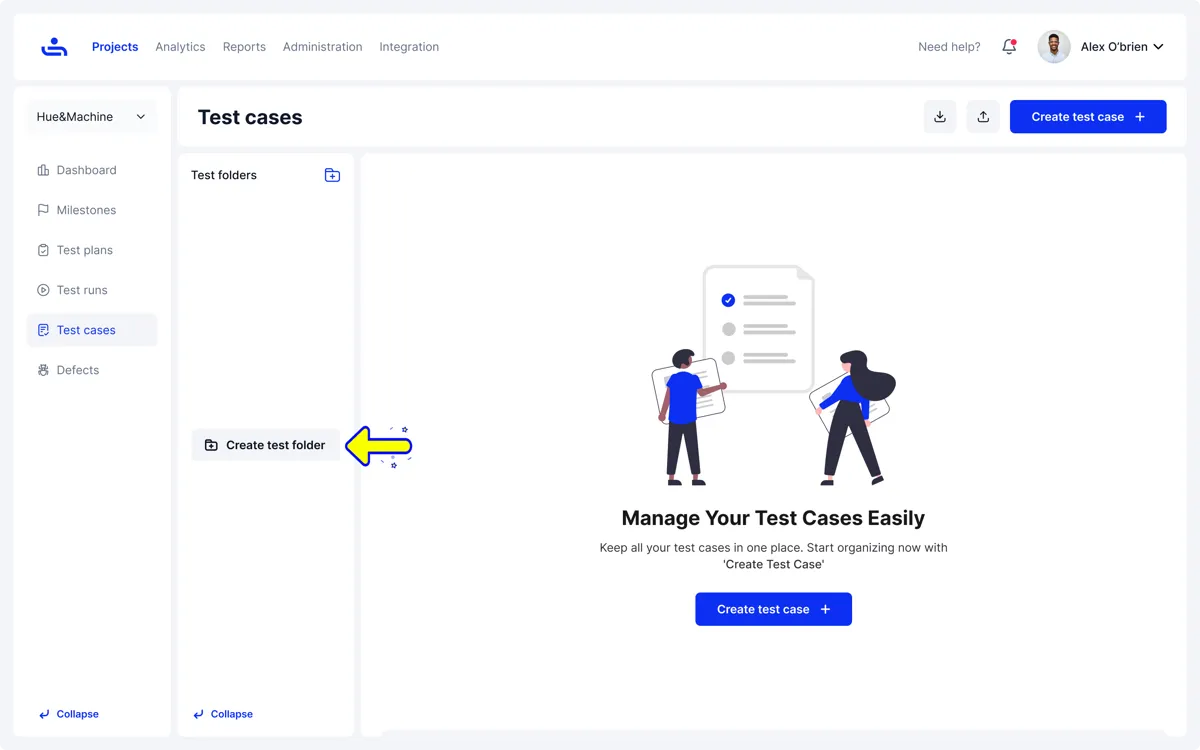
Screenshot of TestFiesta test management application – create a test case.

Once requirements are clear, testers  write structured test cases that explain exactly how to verify each feature. A solid test case includes:

  • Preconditions (what needs to be ready first)
  • Step-by-step instructions
  • Expected results
  • Any necessary test data

These cases should cover everything from “happy path” scenarios where users do everything right, as well as negative testing for error handling, edge cases with unexpected inputs, and boundary conditions at the limits. The goal is to build a library of clear, reusable test cases that any team member can execute consistently.

Organize Test Cases

As you create more test cases, your repository grows, which requires organization to prevent chaos. A test management tool enables you to group related test cases into logical test suites based on application modules, user workflows, sprint cycles, or risk levels. This organization makes it easy to locate specific tests when needed, run the right subset for different situations, and keep everything manageable as your product evolves and changes over time.

Pro Tip: TestFiesta also enables custom tagging, which means you can assign a custom tag to any test case so it’s easier to find it later without having to look up the case by its specific technical name or applying multiple filters. 

Assign Test Cases

Once test cases are ready, the next step is to assign them to the right people. QA managers assign specific tests or test suites to team members based on their skills, availability, and workload. This might mean giving certain modules to testers who are well-versed in them, or spreading the workload evenly during busy release cycles. The point is: assigning test cases through a centralized platform makes it easier to collaborate with your team, track ownership, and monitor deadlines. 

Execute Tests

Execution is where you perform actual tests. In this phase, testers follow the documented steps for each test case and compare actual results against expected outcomes. Manual execution involves hands-on interaction with the application, while automated tests run through scripts in CI/CD pipelines. During execution, testers can record pass/fail status, capture screenshots or logs for failures, and note any deviations from expected behavior.

Log Bugs & Issues

Test management systems have a really good workflow when it comes to test cases that fail. When a test fails, you can create detailed defect reports in issue tracking systems like Jira, GitHub, and others. These reports include environment details, severity ratings, supporting evidence (like screenshots or error logs), and, most importantly, how to reproduce the logged bug. Each bug report is linked back to the specific test case that found it, which creates clear traceability between passed and failed cases. 

Track Progress

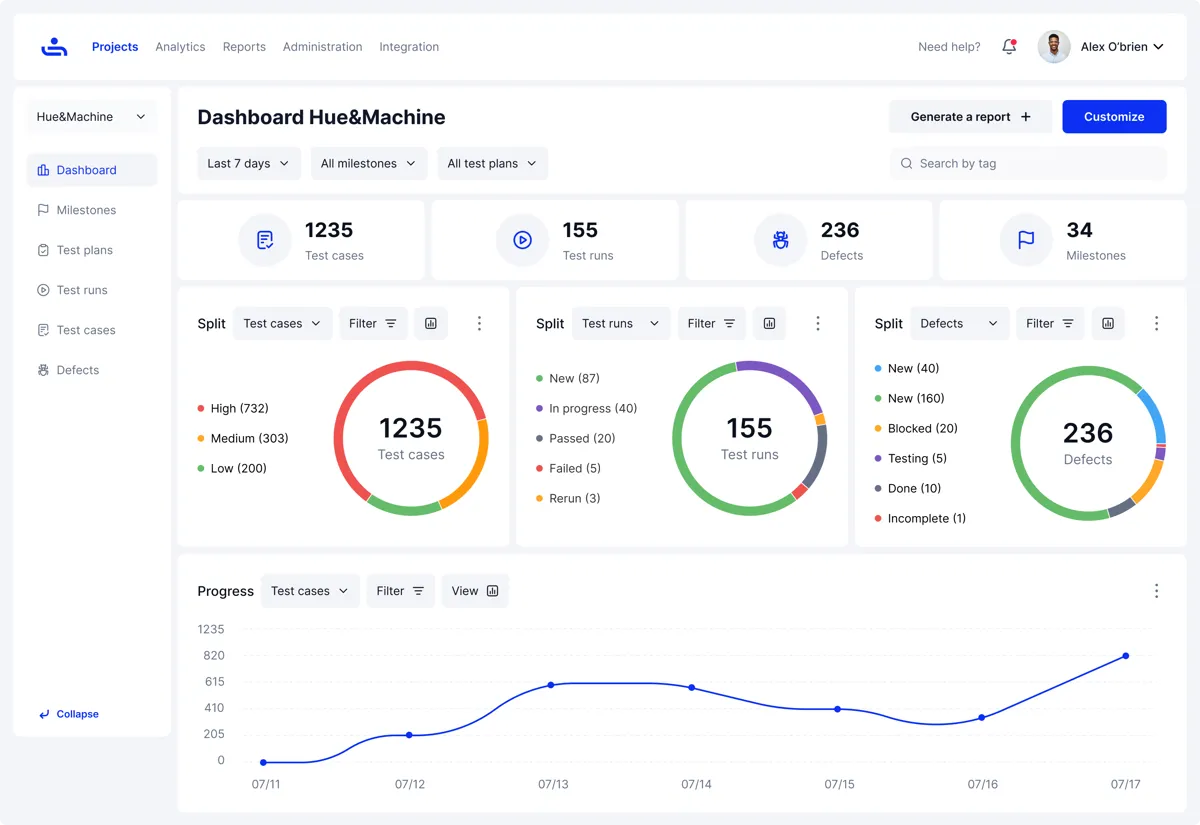
Screenshot of the TestFiesta application - creating a test case

Clear visibility into your product’s testing status remains indispensable throughout the testing cycle. Some key metrics that you can monitor through a test management tool are test execution progress, pass/fail ratios, defect trends, coverage gaps, and testing speed.  Dashboards and reports also reveal bottlenecks, highlight high-risk areas with many failures, and show how far the product is on track for release. When you have a clear picture, resource allocation becomes an easier decision. 

Retest & Regression

After developers fix bugs, QA teams retest those specific scenarios to confirm the issues are actually resolved. But testing is like LEGO; fixing one thing can sometimes break another, which is where regression testing comes in. In regression testing, teams run broader test suites to make sure recent code changes haven't accidentally broken features that were working fine previously. This step keeps the usability of all features in check as your product gets ready for deployment.

Review & Optimize

Test cases aren't static documents; they require ongoing maintenance if you want them to support your evolving product. Regular reviews help identify outdated test cases that no longer match current functionality. When needed, teams can also perform optimizations, such as refining test case wording for clarity, updating test data, removing obsolete cases, and adding new ones for recent features. 

Generate Reports

Your testing data plays a big part in your resource allocation and future planning. Test management systems generate comprehensive reports and dashboards that show test coverage, execution trends, defect distribution, release readiness scores, and quality metrics. These reports serve different audiences: managers use them to gauge sprint health, executives get a high-level view of product quality, and teams can establish their testing credibility during audits or compliance checks. Customizable reporting gets each stakeholder the information they need to make decisions.

Benefits of Using a Test Case Management Tool

A test case management tool transforms how QA teams work by bringing structure, visibility, and efficiency to the testing process. Below is a more detailed overview of the key benefits of using modern and flexible test management tools for your QA process.

Streamlines Test Execution and Tracking

A test case management app brings all testing activity into one place, removing the need to jump between multiple tools and Slack channels. Testers can run tests, log results, and keep an eye on the progress of the team; all without switching tabs. It cuts down on admin work and helps teams keep their testing flow steady.

Pro Tip: TestFiesta adds more flexibility to test management by simplifying your QA fiesta with custom fields and a user-friendly dashboard, getting the work done in far fewer clicks than most platforms. 

Reduces Human Error and Redundancy

When test cases are centralized and version-controlled, duplicate work is out of the window. Teams are far less likely to counter inconsistencies in test processes because they follow the same standardized cases, which reduces manual errors and reinforces consistency across the workflow.

Improves Communication and Collaboration

A test case management app gives everyone access to the same testing data. Testers can check each other’s assignments, developers can see the tested features, QA leads can track progress, and stakeholders can review reports without needing manual updates from the team.

Speeds Up Releases Through Better Visibility

QA leads hate it when they don’t have a release date on the horizon, and it’s worse for marketing. A prominent benefit of a test management tool is clear visibility into testing status. Teams can identify blockers early and address them before release. As a result, everyone knows what's ready and what still needs attention—and release timelines become more predictable.

Supports Agile and Continuous Testing Workflows

Agile teams need quick adaptation, and a good test management platform fits the bill. It makes it easier to update test cases, rerun tests, and track results across sprints, keeping the workflow on track without hurdles. 

How to Choose the Right Test Case Management System

Choosing the right test case management system depends on your team's size, workflow, and integration needs. Here's a step-by-step approach to evaluate and select the best tool:

Assess Your Testing Volume and Team Size

Start by understanding how many test cases your team manages on average and how many testers will use the system. You don’t need an exact number, but a ballpark helps you find the right match for your needs. Larger teams with extensive test suites need tools that can handle high volumes and provide strong access controls without breaking down. Smaller teams may prioritize simplicity and ease of use over advanced features.

Identify Required Integrations 

Review the tools your team already uses, including issue trackers, like Jira and GitHub, and automation frameworks. An ideal test case management system should integrate with these tools to avoid creating workflow gaps. If you’re choosing a platform for a startup, look for mainstream features that help you ease into testing without many obstacles. 

Check for Dashboard Analytics and Reporting Tools

Evaluate the reporting structure of a tool you want to use. The dashboard should display key metrics like test coverage, pass/fail rates, defect trends, and execution progress. A good tool should support flexible reporting that lets you customize views for different audiences, detailed metrics for QA leads, and high-level summaries for executives. The best tools make it easy to extract and share insights in multiple formats.

Compare Free vs. Paid Features

Many test case management tools offer free plans, which can be perfect for individual use or those trying things out. However, free tools often have limitations. Evaluate what's included and what's locked behind paywalls. Some tools limit essential features like integrations, custom workflows, advanced reporting, or user seats in their free versions. Review the feature breakdown carefully to determine whether a free plan genuinely meets your needs, or if upgrading is a valuable investment. 

Try a Free Trial/Free Account Before Committing

Before making a decision, use your free trial to test the tool with real test cases and workflows. Create a project, write a few test cases, execute a test run, and evaluate how intuitive the interface is. A hands-on experience will give you an actual lookout into the tool’s functionality. If you get the hang of the platform easily, it might be time to bring in your team with an upgrade.

Using TestFiesta for Test Case Management

Testing isn’t supposed to be a daunting task. Unlike traditional test management tools that force teams into rigid, one-size-fits-all workflows, TestFiesta gives you the flexibility to build a workflow that fits your team's needs. With customizable fields, flexible tagging, and configurable test structures, teams can organize and execute tests in a way that makes the most sense for their projects. 

TestFiesta supports integrations with Jira and GitHub, allowing testers to link defects directly to failed test cases. It also includes Fiestanaut AI, your personal copilot for AI-powered test case generation. You get shared steps for reusable test components and real-time collaboration tools that keep teams synchronized.

The best thing? TestFiesta offers a free plan for individual users with full feature access (no paywalls) and a flat-rate pricing model of $10 per user per month for organizations. No complex tires; just unwavering flexibility. Get started today. 

Conclusion

Test case management turns scattered testing efforts into an organized, scalable process that grows with your product. When evaluating test case management tools, prioritize factors that directly impact your team's efficiency, including integrations, reporting, and pricing. The smartest approach is to pick a tool that allows flexible management of test cases while simultaneously fostering collaboration—without clunky, rigid interfaces. TestFiesta offers a free plan with complete feature access and straightforward $10/user/month team pricing. Build failsafe products with modular test management. 

FAQs

What is test case management?

Test case management is the process of creating, organizing, and tracking test cases throughout the software testing lifecycle. QA teams get clearer visibility into test coverage, execution status, and defect tracking, harnessing releases with a more organized approach.

What is a test case management system?

A test case management system is software that facilitates test management. It helps teams create, execute, and monitor test cases in one centralized platform. A good system enables a smarter organization, simple execution, and efficient result tracking, without requiring you to switch tabs.

How is a free test case management system different from paid tools?

Free test case management systems typically offer basic functionality like test case creation, execution tracking, and simple reporting. Paid tools often include advanced features such as custom fields, automation integrations, detailed analytics, and priority support. TestFiesta provides full feature access in the free plan for individual users and charges a flat fee per user only for organizations.

What are the benefits of using a test case management app?

A test case management app streamlines test execution, reduces manual errors, and improves communication between QA, development, and stakeholders. A good test case management app provides better visibility into testing progress while supporting agile workflows. With a smart and flexible tool, teams can release software faster with higher quality.

How does a test case management dashboard help QA teams?

A test case management dashboard provides a real-time overview of testing activity, including test execution status, defect trends, and overall progress. It helps QA teams identify blockers, track completion, and make informed decisions about release readiness.

What is the price of a good test case management system?

TestFiesta offers a flat rate of $10 per user per month with no feature tiers or hidden costs. A free plan is also available for individual users.

Tool

Pricing

TestFiesta

Free user accounts available; $10 per active user per month for teams

TestRail

Professional: $40 per seat per month

Enterprise: $76 per seat per month (billed annually)

Xray

Free trial; Standard: $10 per month for the first 10 users (price increases after 10 users)

Advanced: $12 per month for the first 10 users (price increases after 10 users)

Zephyr

Free trial; Standard: ~$10 per month for first 10 users (price increases after 10 users)

Advanced: ~$15 per month for the first 10 users (price increases after 10 users)

qTest

14‑day free trial; pricing requires demo & quote (no transparent pricing)

Qase

Free: $0/user/month (up to 3 users)

Startup: $24/user/month

Business: $30/user/month

Enterprise: custom pricing

TestMo

Team: $99/month for 10 users

Business: $329/month for 25 users

Enterprise: $549/month for 25 users

BrowserStack Test Management

Free plan available

Team: $149/month for 5 users

Team Pro: $249/month for 5 users

Team Ultimate: Contact sales

TestFLO

Annual subscription (specific amounts per user band), e.g., Up to 50 users: $1,186/yr; Up to 100 users: $2,767/yr; etc.

QA Touch

Free: $0 (very limited)

Startup: $5/user/month

Professional: $7/user/month

TestMonitor

Starter: $13/user/month

Professional: $20/user/month

Custom: custom pricing

Azure Test Plans

Pricing tied to Azure DevOps services (no specific rate given)

QMetry

14‑day free trial; custom quote pricing

PractiTest

Team: $54/user/month (minimum 5 users)

Corporate: custom pricing

Black Box Testing

White Box Testing

Coding Knowledge

No code knowledge needed

Requires understanding of code and internal structure

Focus

QA testers, end users, domain experts

Developers, technical testers

Performed By

High-level and strategic, outlining approach and objectives.

Detailed and specific, providing step-by-step instructions for execution.

Coverage

Functional coverage based on requirements

Code coverage

Defects type found

Functional issues, usability problems, interface defects

Logic errors, code inefficiencies, security vulnerabilities

Limitations

Cannot test internal logic or code paths

Time-consuming, requires technical expertise

Aspect

Test Plan

Test Case

Purpose

Defines the overall testing strategy, scope, and approach for a project or release.

Validates that a specific feature or functionality works as expected.

Scope

Covers the entire testing effort, including what will be tested, resources, timelines, and risks.

Focuses on a single scenario or functionality in the broader scope.

Level of Detail

High-level and strategic, outlining approach and objectives.

Detailed and specific, providing step-by-step instructions for execution.

Audience

Project managers, stakeholders, QA leads, and development teams.

QA testers and engineers.

When It's Created

Early in the project, before testing begins.

After the test plan is defined and the requirements are clear.

Content

Scope, objectives, strategy, resources, schedule, environment details, and risk management.

Test case ID, title, preconditions, test steps, expected results, and test data.

Frequency of Updates

Updated periodically as project scope or strategy changes.

Updated frequently as features change or bugs are fixed.

Outcome

Provides direction and clarifies what to test and how to approach it.

Produces pass or fail results that indicate whether specific functionality works correctly.

Tool

Key Highlights

Automation Support

Team Size

Pricing

Ideal For

TestFiesta

Flexible workflows, tags, custom fields, and AI copilot

Yes (integrations + API)

Small → Large

Free solo; $10/active user/mo

Flexible QA teams, budget‑friendly

TestRail

Structured test plans, strong analytics

Yes (wide integrations)

Mid → Large

~$40–$74/user/mo)

Medium/large QA teams

Xray

Jira‑native, manual/
automated/
BDD

Yes (CI/CD + Jira)

Small → Large

Starts ~$10/mo for 10 Jira users

Jira‑centric QA teams

Zephyr

Jira test execution & tracking

Yes

Small → Large

~$10/user/mo (Squad)

Agile Jira teams

qTest

Enterprise analytics, traceability

Yes (40+ integrations)

Mid → Large

Custom pricing

Large/distributed QA

Qase

Clean UI, automation integrations

Yes

Small → Mid

Free up to 3 users; ~$24/user/mo

Small–mid QA teams

TestMo

Unified manual + automated tests

Yes

Small → Mid

~$99/mo for 10 users

Agile cross‑functional QA

BrowserStack Test Management

AI test generation + reporting

Yes

Small → Enterprise

Free tier; starts ~$149/mo/5 users

Teams with automation + real device testing

TestFLO

Jira add‑on test planning

Yes (via Jira)

Mid → Large

Annual subscription starts at $1,100

Jira & enterprise teams

QA Touch

Built‑in bug tracking

Yes

Small → Mid

~$5–$7/user/mo

Budget-conscious teams

TestMonitor

Simple test/run management

Yes

Small → Mid

~$13–$20/user/mo

Basic QA teams

Azure Test Plans

Manual & exploratory testing

Yes (Azure DevOps)

Mid → Large

Depends on the Azure DevOps plan

Microsoft ecosystem teams

QMetry

Advanced traceability & compliance

Yes

Mid → Large

Not transparent (quote)

Large regulated QA

PractiTest

End‑to‑end traceability + dashboards

Yes

Mid → Large

~$54+/user/mo

Visibility & control focused QA

Related Articles

Introduction

Manual testing and automated testing are the two ways a QA team verifies that software works. In manual testing, a person runs the application and checks the results. In automated QA testing, scripts do the running, and a tester reads the results. 

This guide covers what manual and automated testing are designed for, where each one fits and fails, and how to decide the ideal testing approach split for your own team based on what you’re building.

What Is Manual Testing

Manual testing is a type of software testing where a human runs the software the way a user would, without automated scripts executing the steps for them. The tester opens the app, follows a test case or their own line of thinking, watches what happens, and records what they find. That’s a simple way to describe it. 

Following a written test case step by step is the least interesting part of the job. What separates a good manual tester from someone clicking buttons is judgment and the ability to notice small details, such as a form accepting information that it shouldn’t, a loading spinner hanging a beat too long, or a vague error message that’s not any help to the users. None of these issues could formally be a part of any test case, but a manual tester would still catch them, as opposed to an automated script that would pass them.

Since manual testing involves human judgment, it’s slow. But in the long run, it uncovers issues during testing that could otherwise appear in production, which is its primary benefit.

Where Manual Testing Works

A good tester recognizes that automation cannot do everything. Manual testing is the right call for a lot of scenarios, including:

  • Exploratory testing: In exploratory testing, a tester works without a script or a written test case. They manually form and test hypotheses about where the software breaks. This is where the bugs nobody wrote a test case for get found.
  • Usability and UX evaluation: A script can confirm a button exists and is clickable, but it can’t tell you if the button is in the wrong place, the label is confusing, or the flow takes two steps more than it should. That’s where testers utilize usability testing and UX evaluation.
  • Accessibility testing: Automated scanners are useful, but they catch a fraction of the problems. In many cases, automated accessibility testing tools only find half the issues that a manual tester can find simply by navigating through the screens.
  • Early-stage features: When the UI is being redesigned every few days, automation written previously would be broken after the changes. Manual testing absorbs the change without maintenance cost.
  • One-off tests: Automation works well when you’re doing it at scale. For one-off tests like data migrations, configuration changes, and a release-specific check, manual testing is more efficient. 

What Is Automated Testing

Automated testing uses scripts and tools to execute test cases programmatically. Someone writes the test once, and from then on, it runs automatically, on demand or on a schedule, as many times as needed, at whatever hour the pipeline triggers.

The standard way to think about the layers is the testing pyramid. At the base of the pyramid are unit tests, which are fast and isolated and check individual functions. Above the base are integration tests, which verify that components work together. At the top are end-to-end tests that drive the full application through the UI. The pyramid shape is the point. You want many cheap and quick tests at the bottom and few expensive, slow, and fragile ones at the top.

Automation exists to take repetitive verification off people’s plates so they can do more strategic work. A team with a focus on automation doesn’t need fewer testers. It needs its testers to do exploratory and usability testing instead of re-running last quarter’s regression suite by hand.

Where Automated Testing Works

Automation pays off when the same check needs to run many times, or when the check is physically impossible for a human to perform, such as:

  • Regression testing: Regression testing verifies that the new code didn’t break existing functionality. This is the single highest-return automation target because the suite runs on every change and the cost of writing it is amortized across hundreds of executions.
  • Smoke tests: Smoke tests are a small set of checks on critical paths (login, checkout, the core workflow) that run after every deployment. They take minutes and catch the failures that would otherwise reach users first.
  • API testing: APIs change less often than UIs and don’t have layouts to break. API testing is fast, stable, and cheap to maintain, and API tests catch broken changes before a frontend ever hits them.
  • Performance and load testing: Making sure that your software works as well on 5000 users as it does on 500 is not something you can do manually. That’s why performance testing exists, and it’s done through automation.
  • Cross-browser and cross-device testing: Cross-browser and cross-device testing runs the same test suite across browsers, such as Chrome, Firefox, and Safari, and a range of screen sizes, such as desktop, mobile, and tablet, in parallel. Doing this manually means multiplying every test case by every test environment, which is why these tests are automated.
  • Data-driven tests: Data-driven tests are executed on specific data, such as a form with 50 valid and invalid input combinations, which is tedious to test by hand and trivially parameterized in code.

The Difference Between Manual and Automated Testing

Choosing between manual and automated testing is not a one-off decision. And QA teams should stop thinking in terms of which approach is better. The right question to ask is which approach is the right one for your product. 

Manual vs Automated Testing

Here’s a table that will make things easier to understand:

Manual testing Automated testing
Best at Finding unknown problems Confirming known behavior still works
Speed per run Slow Fast once written
Upfront cost Low High (tooling, scripting, setup)
Ongoing cost Scales with every run Maintenance when the app changes
Repeatability Varies by tester and day Identical every time
Handles UI change Adapts immediately Breaks, needs updating
Catches Usability, accessibility, edge cases nobody scripted Regressions, performance, high-volume data cases
Misses Anything too repetitive or high-volume to do thoroughly Anything requiring judgment about whether the result is good, not just correct

Most mature teams utilize both manual and automated testing, with around 70 percent of test execution automated and 30 percent manual. That said, there’s no hard-and-fast rule about the ideal split. A backend-heavy platform with stable APIs can push well past 70 percent, and a consumer app in active redesign should sit closer to 50 percent. The split matters less than what goes on each side: repetition to the machines, judgment to the people.

Manual vs Automated Testing: Pros and Cons

Here are some pros and cons of manual and automated testing.

Manual Testing

Manual testing’s pros include:

  • No setup, tooling, or scripting cost to get started
  • Finds bugs that weren’t anticipated
  • The only option for usability, accessibility, and exploratory work
  • Adapts to UI changes instantly
  • Testers build product knowledge that feeds back into design and requirements

Manual testing’s common cons are:

  • Slow, and cost grows linearly with every run
  • Results vary by tester and their attention to detail
  • Can’t cover load, performance, or large data sets
  • Regression cycles get longer as the product grows
  • Prone to human error

Automated Testing

Automated testing pros are:

  • Runs in minutes, at any hour, on every commit
  • Identical execution every time
  • Handles volume no human can: thousands of users, hundreds of inputs, dozens of browsers
  • Cost per run approaches zero over time
  • Frees testers for higher-value work

Automated testing’s common cons include:

  • Significant upfront investment in tools, infrastructure, and skills
  • Maintenance burden every time the application changes
  • Flaky tests erode trust in the whole suite
  • Only checks what it was told to check; a passing suite proves nothing about what wasn't scripted
  • Poorly chosen automation (usually too much at the UI layer) costs more than it saves

TestFiesta Gives Your QA Team a Home for Both

The gap on most teams isn’t a shortage of testers or a shortage of scripts. It’s that the results of both manual and automated testing don’t often live in the same place. Automated runs report into CI dashboards, whereas manual test cases live in a spreadsheet, a wiki, or a tool the automation engineers never open. 

When a release manager is about shipping, someone has to go collect answers from three different places and stitch them together, and the stitching is where things get missed.

TestFiesta puts manual and automated testing under one roof. Manual test cases, exploratory sessions, and automated results feed into the same test runs, so coverage is visible in one view instead of being inferred from several. 

In TestFiesta, you can see which requirements are covered by automation, which are covered manually, and which aren’t covered at all. When a regression suite passes but a tester flags a usability problem in the same feature, both show up together against the same release.

Bring your manual and automated testing under TestFiesta, centralize your test cases, and release with total confidence.

Start your free trial today

FAQs

Will automated testing eventually replace manual testing entirely?

No, automation replaces repetition, not judgment. A script only checks what it was told to check, so usability, accessibility, and exploratory work still need a person and human judgment. 

What’s the best tool to start with for automated testing?

The best tools for automated testing depend on your needs. For web UI, Playwright is the strongest current option. For mobile testing, use Appium. Begin with five to ten smoke tests on your most critical paths, get them running in CI, and expand from there.

How much of our QA budget should go toward automation?

To decide the budget to go toward automation, look carefully at your regression suites because that’s the first thing you need to automate. From then on, look at other forms of testing that can be automated, such as smoke testing, API testing, and cross-browser and cross-device testing. Building and scaling these test suites often takes more time and cost than it would take to automate them. A good rule of thumb is to start with a 70 percent automation and 30 percent manual split, and then change the split based on your needs.

Testing guide

Introduction

Performance testing is one of the most important types of software testing that determines whether your software stays fast, stable, and reliable when real traffic comes in. 

This guide will explain performance testing in detail and break down the six types of performance testing, along with metrics that actually matter and the tools built for each type, including AI-specific options. 

You’ll also find playbooks for API load testing, LLM performance testing, and building performance gates into your CI/CD pipeline, so you can catch regressions before your users do.

What Is Performance Testing in Software

Performance testing is the practice of measuring how a software system behaves under demand: how fast it responds, how stable it stays, and how well it scales as load increases.

Where functional testing asks “does it work?”, performance testing asks “does it stay fast and reliable when real users arrive?” 

In simple words, a checkout flow that passes every functional test can still collapse on Black Friday due to traffic. And performance testing exists to find that out before your customers do.

The 6 Types of Performance Testing

Performance testing is an umbrella term that includes several types of testing, including load testing, stress testing, spike testing, and soak testing. Each applies a different traffic pattern to the same system to answer a different question: can it handle expected traffic, where does it break, can it absorb a surge, and does it degrade over time? Understanding which question you are asking determines which test you run.

Load Testing

Load testing simulates the number of concurrent users the system is expected to handle at normal peak traffic. You ramp to target concurrency, hold it there, and measure response times, error rates, and resource utilization while the system works.

This answers the most fundamental performance question: can the system handle the traffic it was built for? Run it before every major release and after any significant architectural change. The output is a baseline, a known-good performance profile that every subsequent test gets measured against. Without that baseline, you cannot tell a regression from normal variance.

Stress Testing

Stress testing pushes the system past its known limits. You keep increasing the load until something fails, deliberately. It answers the question load testing does not: what happens when traffic exceeds capacity?

The failure mode matters as much as the failure point. Does the system fail gracefully, queuing requests and returning 503s with retry headers? Or does it fail catastrophically, crashing, corrupting data, or hanging indefinitely? A system that degrades gracefully under overload is operationally manageable. One that crashes silently is not, and you want to learn which one you have in a test environment rather than an incident channel.

Spike Testing

Spike testing applies a sudden, sharp increase in load, an instantaneous jump to high concurrency. It simulates the traffic events that actually take systems down: a product launch, a viral social post, a flash sale, or a breaking news story.

The question it answers is whether the software can absorb the transition from normal to extreme without dropping requests or corrupting state. Autoscaling that takes three minutes to respond is useless against a spike that arrives in three seconds.

Soak Testing

Soak testing, also called endurance testing, runs a moderate load for an extended period, usually in hours. It surfaces the failure modes that never appear in short tests, such as memory leaks that accumulate slowly, connection pool exhaustion, log files that fill disks, database index fragmentation, and cache eviction patterns that degrade hit rates over time.

A system that passes a 10-minute load test and fails after 6 hours of normal traffic has a soak problem, and no amount of short testing will find it. Run soak tests on a weekly schedule in a staging environment to stay on top of your product’s durability.

Scalability Testing

Scalability testing increases load in controlled steps and measures how performance changes at each level. It answers the architectural question: does performance degrade linearly, sublinearly, or does it cliff at a specific threshold?

A system that handles 100 concurrent users at 200ms p95 and 1,000 concurrent users at 210ms p95 scales well. One that handles 100 users at 200ms and 500 users at 4,000ms has a bottleneck that will surface in production at a specific traffic level. Scalability testing tells you exactly where that level is, so capacity planning becomes math instead of guesswork.

Volume Testing

Volume testing stresses the system with large volumes of data rather than large numbers of users. It surfaces a different class of failure entirely, such as database queries that run fine on 10,000 rows and time out on 10 million, report generation that works at 1,000 records and exhausts memory at 100,000, and search indexes that degrade as the corpus grows.

Teams that focus exclusively on concurrent users overlook this one, and it is critical for any application where data volume grows continuously. Your user count might stay flat while your database quietly grows toward a cliff.

Important Performance Testing Metrics 

Performance testing measures the following two fundamentally different aspects of a system:

Server-side metrics: These describe how the backend performed and include: 

  • Response time (p50/p95/p99). Always read response time as percentiles, not averages. An average response time of 200ms that hides a p99 of 8,000ms means 1 in 100 users waits 8 seconds. The p95 is your SLA number; the p99 is your early-warning threshold.
  • Throughput. Throughput is the number of requests per second the system successfully handles. The ceiling where throughput plateaus while latency keeps climbing is your saturation point, and it is worth knowing before production finds it for you.
  • Error rate. Error rate is the percentage of requests returning errors like 5xx responses, timeouts, and connection refusals. Below 0.1% is healthy. Above 1% under load is a hard failure.
  • Resource utilization. Resource utilization measures CPU, memory, database connection pool, and GPU utilization for AI systems. These numbers spike before latency does, which makes them your earliest signal that saturation is approaching.

Experience-side metrics: These describe what the user actually felt:

  • Core Web Vitals. Core Web Vitals include Largest Contentful Paint (LCP), Interaction to Next Paint (INP), and Cumulative Layout Shift (CLS). LCP measures when the main content loads, INP measures how fast the page responds to clicks, and CLS measures how much the layout jumped around. These can only be measured in a real browser, not by protocol-level tools that never execute JavaScript.
  • Time to First Byte (TTFB). TTFB measures how long before the browser receives the first byte of the response. A fast TTFB does not guarantee a fast page. A slow TTFB guarantees a slow one.
  • Total page load time. Total page load time measures the time to load the full experience, including JavaScript execution, image loading, and third-party scripts. This is what users actually experience, and it can be many times the server response time.

API Performance Testing: 4-Step Playbook

API performance testing is where protocol-level tools shine. Stateless requests, deterministic responses, and high concurrency requirements map directly onto what k6, JMeter, and Gatling were built for. Four practices separate useful API load tests from theater:

1. Test each endpoint independently before testing the full flow. A bottleneck at one endpoint stays invisible inside an end-to-end flow test until it is consistent enough to surface at p95. Isolate first, integrate second.

2. Use realistic request distributions. A load test that sends the same request 10,000 times is not representative of anything. Production traffic has a distribution of payload sizes, query complexities, and authenticated versus unauthenticated requests. Sample from production logs to build scenarios that resemble reality.

3. Test error handling under load. Most teams test the happy path under load and assume error handling works. Deliberately inject failures at load: timeouts, malformed payloads, auth failures. Then verify that the error responses are correct, the retry logic does not amplify load into a self-inflicted outage, and the circuit breakers trip at the right thresholds.

4. Establish a performance budget per endpoint. Define acceptable p95 response times for each endpoint before testing, not after. A search endpoint at 500ms p95 is a different standard than a health check at 20ms p95. Without per-endpoint budgets, performance testing produces numbers with no pass/fail criteria attached, which is measurement, not testing.

Tips to Do AI Performance Testing

AI performance testing has different failure modes, different testing metrics, and different tooling requirements, and treating an inference endpoint like a REST API will give you clean dashboards over a degrading system.

Here are some tips to note if you’re building on LLMs:

TTFT and ITL Are Your Primary Metrics. Time to First Token (TTFT) is the LLM equivalent of TTFB: how long before the user sees any output at all. Inter-Token Latency (ITL) measures how consistently tokens stream after the first one. A TTFT of 500ms with a steady 50ms ITL feels fast. A TTFT of 200ms with 2-second pauses between tokens feels broken, even if the total response time is similar. ITL degradation is typically the first visible symptom of GPU saturation, appearing before TTFT degrades.

Notice GPU saturation, not CPU saturation. AI inference is GPU-bound. Monitor GPU compute utilization, GPU memory, and KV cache usage throughout load tests. HTTP latency is a lagging indicator here: by the time it spikes, the GPU has been saturated for a while, and the request queue is already growing. GPU metrics are the leading indicators, and standard load tools do not collect them.

Quality and speed degrade under load. For traditional APIs, correctness is binary. The response matches the expected output, or it does not. For LLM systems, output quality can degrade under high concurrency, and latency metrics will never show it. The fix is to mix canary prompts with known-good reference outputs into load test traffic and score the responses. A quality drop that only appears at high concurrency is a real capacity limit, and it is invisible to every latency chart you have.

Cost is a performance dimension. A traditional API can scale horizontally at roughly linear cost. GPU capacity scales in discrete, expensive jumps, and underutilized GPU instances represent significant wasted spend. Load test results for AI systems need to inform capacity provisioning and cost-per-request modeling, not just SLA commitments. A configuration that meets latency targets at twice the necessary cost has failed a performance test, just a different one.

TestFiesta Brings Performance Test Results Into the Same Place as Everything Else

Performance testing generates some of the most actionable quality signals in software development, such as a p95 regression, a throughput ceiling, a soak failure, and quality degradation under load. Those signals live in different places, like a k6 dashboard, a CI log, a load test report, a Grafana board, or a spreadsheet someone updates before releases. 

None of it connects to the test cases your QA team maintains, the release decisions your leads make, or the coverage picture anyone tracks.

TestFiesta closes that gap. It gives you structured test case organization across functional and performance testing, pass/fail tracking against the performance budgets your CI enforces, and release readiness visibility that offers quick, actionable, and objective insights with one view of a customizable dashboard. Performance results become part of the same quality record as everything else, because that is where release decisions actually get made.

Performance metrics, CI logs, and QA test cases shouldn’t live in isolation.

TestFiesta bridges the gap by centralizing your functional and performance testing into one source of truth.

Start your free trial on TestFiesta today

FAQs

What’s the difference between performance testing and load testing?

Load testing is one specific type of performance testing. It simulates expected peak concurrent users to verify the system holds up under normal demand. Performance testing is the umbrella discipline that includes load, stress, spike, soak, scalability, and volume testing, each applying a different traffic pattern to answer a different question. 

When should performance testing start in the development lifecycle?

Performance testing should start as early as the component level, not as a pre-release activity. Testing individual APIs, database queries, and service endpoints catches bottlenecks when they are cheapest to fix, before they are embedded in an integrated system. 

What tools should I use for performance testing?

The tools you should use for performance testing depend on what you’re testing. For API and high-concurrency load testing, k6 is the modern developer-friendly choice, with JavaScript test scripts, CLI execution, and native CI/CD integration. JMeter is the mature enterprise option with the widest protocol support. For web application experience testing, including Core Web Vitals under load, use a real-browser tool such as a Playwright-based load generator or Evaluat. For AI inference benchmarking, NVIDIA’s AIPerf (formerly GenAI-Perf) measures TTFT, ITL, and throughput directly. 

How is AI performance testing different from traditional performance testing?

AI performance testing is different from traditional performance testing in four fundamental aspects. One, in AI performance testing, the primary latency metrics are Time to First Token (TTFT) and Inter-Token Latency (ITL) rather than response time. Two, the resource bottleneck is GPU memory and compute rather than CPU. Three, output quality can degrade under high concurrency, not just speed, which requires quality scoring mixed into load test traffic. Four, cost is a first-class performance dimension because GPU scaling is discrete and expensive.

Testing guide

Introduction

Most types of testing focus on what software does. But white box testing looks at how it does it. By examining the code behind the interface, testers can catch logic errors, security gaps, and untested paths that black box methods miss entirely. This guide covers what white box testing is, how it works, and how to apply it effectively.

What Is White Box Testing?

White box testing is a software testing method where test cases are designed using knowledge of the application’s internal code. Instead of treating the software as a sealed unit and checking only its outputs, the tester works directly with the logic that produces those outputs: the paths execution can take, the branches and conditions that decide between them, and the loops that repeat them.

The goal is to go beyond confirming that correct inputs produce correct results and verify that the logic itself is sound, that every meaningful path through the code gets exercised, and that no hidden route exists that could fail under conditions nobody thought to try from the outside.

The name “white box” comes from a simple contrast: Black box testing sees only the exterior of the software. White box testing, sometimes called glass box testing, sees everything inside.

White Box vs. Black Box vs. Gray Box: What’s the Difference

White box testing, black box testing, and gray box testing all tell you different things about your software.

White box testing gives the tester full visibility into source code, architecture, and internal logic. Test cases are built around code structure, which makes this method effective at finding logic errors, dead code, security vulnerabilities buried in code paths, and branches no test has ever touched. It’s typically performed by developers and software development engineers in test (SDETs), and it lives mostly at the unit and integration levels.

Black box testing works with no knowledge of internals. Test cases come from requirements, specifications, and expected user behavior, which makes this method effective at finding functional failures, usability problems, and gaps between what was built and what was asked for. It’s typically performed by QA engineers and end users at the system and acceptance levels.

Gray box testing combines partial internal knowledge with external behavior testing. The tester knows enough about the architecture, perhaps through system diagrams, API documentation, or database schemas, to design smarter tests without full code access. It bridges the gap between developer-authored unit tests and QA-authored functional tests, and it earns its keep in API testing and integration scenarios involving third-party systems.

Learn more about the difference between black-box testing and white-box testing.

The 6 White Box Coverage Techniques and When to Use Each One

White box testing isn’t a single technique but a family of coverage criteria, each measuring a different dimension of how thoroughly the code has been exercised. 

1. Statement Coverage

Statement coverage states that every executable statement in the code must run at least once. It’s the most basic coverage criterion, the easiest to achieve, and the easiest to game. A test suite with 90% statement coverage can still miss the one branch that throws a NullPointerException in production. If your statement coverage sits below 80%, you have a significant amount of untested code. 

2. Branch Coverage

Branch coverage measures that every possible branch at every decision point must be exercised, meaning both the true and false paths of every if, else, switch, and ternary. Branch coverage is stronger than statement coverage because it forces tests for conditions that statement coverage ignores. A function with an if/else can hit 100% statement coverage with a single test that only takes the if path. Branch coverage requires both. For most production codebases, this is the right default target. It catches the logic errors that matter most without the combinatorial explosion of full path coverage.

3. Condition Coverage

In condition coverage, each individual boolean sub-expression within a complex condition must evaluate as both true and false, independently. Where branch coverage tests the outcome of a decision, condition coverage tests the individual components driving it. It earns its cost in functions with compound conditions, like if (age >= 18 && has_id && is_student), where a bug in one sub-expression can be masked by the behavior of another. It’s not necessary everywhere. Apply it selectively to authentication logic, access control checks, and business rules built on multiple independent conditions.

4. Path Coverage

Every possible execution path through the code, from entry to exit, must be tested. It’s the most thorough criterion and the most expensive, because the number of paths grows exponentially with the number of conditional branches. A function with three independent if statements already has eight possible paths. Full path coverage is impractical for most codebases at scale, so apply it where a missed path carries real consequences: payment processing logic, authentication flows, and safety-critical functions. For everything else, branch coverage is sufficient.

5. Data Flow Testing

Data flow testing tracks variables through their lifecycle, where they’re defined, where they’re used, and whether every define-use pair is exercised by at least one test. It catches a class of bugs that coverage percentages miss entirely, such as variables defined but never used, variables used before initialization, and values transformed incorrectly between assignment and use. It’s particularly valuable for functions with complex state management, data transformation pipelines, and code that passes mutable objects between methods.

6. Mutation Testing

Mutation testing deliberately introduces small changes into the code, such as flipping a > to >=, changing a + to -, or removing a return statement, and then checks whether the test suite catches them. If a mutation survives and the tests still pass, the suite has a gap: it executed the code but never verified the behavior the mutation changed. This makes mutation testing the only technique on this list that measures test quality rather than test quantity. It’s computationally expensive and slow, so run it on critical modules rather than the entire codebase. A mutation score below 70% on a critical module is a meaningful signal that your coverage numbers are hiding gaps.

White Box Testing Lives in the Software Development Lifecycle

Here’s where white box testing usually occurs in the SDLC:

  • During Development (Unit Testing): Developers write white-box tests alongside the code itself, targeting branch and condition coverage on individual functions. This is the highest-leverage moment for the technique: a bug found here costs minutes to fix, while the same bug found in production costs hours to diagnose and days to remediate.
  • During Integration (Component Testing): SDETs and senior developers apply white-box techniques to the data flow between components, how values pass across module boundaries, whether shared state is managed correctly, and whether integration paths exercise the same error handling that isolated units do.
  • During Security Review (White Box Penetration Testing): Security engineers with full code access probe authentication logic, input validation, access control checks, and cryptographic implementations for vulnerabilities that are invisible from the outside. This is how teams find authentication bypass bugs, insecure default conditions, and hardcoded credentials before attackers do.

TestFiesta Turns White Box Coverage Into a Signal Your Whole Team Can Act On

Everything in this guide points to the same conclusion: white box testing produces the most precise quality signal available. Branch coverage percentages, mutation scores, and maps of untested paths — no other testing method tells you exactly where your risk lies.

But precision only matters if the signal reaches the people making release decisions. A coverage report that lives in a developer’s terminal and a test case that lives in a spreadsheet are both invisible to the QA lead whose primary question is “Are we ready to ship?”

That’s the gap TestFiesta closes. As your test management layer, it gives white box efforts a home the whole team can see: structured test case organization instead of scattered spreadsheets, coverage tracked across CI/CD runs instead of buried in build logs, and release readiness visibility that turns a developer’s coverage report into a quality signal stakeholders can actually read.

Stop letting valuable quality signals get buried in developer logs.

See how TestFiesta turns your white box testing into clear, actionable insights.

Start your free trial today

FAQs

Who performs white-box testing, developers or QA engineers?

White box testing is primarily performed by developers and SDETs, since white box testing requires knowledge of the source code and is naturally owned by people who write or deeply understand the implementation. QA engineers typically own black-box and system-level testing.

What’s the difference between code coverage and test coverage?

Code coverage measures how much of the source code executes during testing, which is measured in statement coverage, branch coverage, and path coverage. Test coverage is broader, measuring how well tests validate the system against requirements, including functional, performance, and security requirements. 

Is white-box testing relevant for teams using TDD?

Yes, white box testing is very relevant for teams using test-driven development (TDD). Writing a test before the code means designing it around the intended internal logic, so TDD teams naturally achieve high branch coverage. Tests exist for each logical path before the path is implemented. What white-box testing adds on top of TDD is the measurement layer, confirming that tests written during TDD actually exercise the paths they were meant to cover, and surfacing gaps where the implementation drifted from the original test design.

Testing guide

Ready for a Platform that Works

The Way You Do?

Stop fighting your tools. Start shipping with confidence. TestFiesta adapts to your workflow, not the other way around.

Welcome to the fiesta!