Ah. Nothing to see here… yet

It may be coming soon, but for now, try refining your search

Thank you! Your submission has been received!
Oops! Something went wrong while submitting the form.

Introduction

Most engineering teams face the same issue at least once in their testing lifecycle: A test fails, testers rerun the pipeline, and the test passes. The test is the same, but it produces different results each time it is run. This is a kind of test that we call a flaky test. 

There’s no definite answer to why a flaky test failed in the first place and passed the second time. But if that happens enough times, your test suite becomes clerical work instead of actual QA.

The usual solution is to delete the test or leave a comment, but neither of these gives you any coverage that you may need later. A better solution is to quarantine a flaky test, with some conditions attached. In this guide, we’ll learn what it means to quarantine a flaky test and how to do it.

What Are Flaky Tests

Flaky tests are the kind of tests that produce different results each time they run without any changes in the code. They may pass or fail inconsistently, which gives testers no clue about what is broken, if anything. 

Flaky tests are a problem because they result in wasted time, wasted cost, and poor trust in releases—a flaky test can indicate that other tests that are actually failing might also be flaky, potentially resulting in inaccurate defect management. 

What It Means to Quarantine a Flaky Test

Quarantining a flaky test means isolating an unreliable flaky test from your primary test suite so that its failures do not block continuous integration or deployment pipelines. Usually, a failed test blocks your deployment pipelines, which means the bug must be resolved and test must be passed before you can continue the integration. However, a flaky test is different from a failed test, so it requires quarantine. 

Instead of outright deleting the test or ignoring its output, a quarantined test is moved to a separate, non-blocking execution lane, so the test keeps running but stops blocking deployment. When the test is quarantined, it can still run and appear in reporting similar to a normal test, but it doesn’t stop the integration.

Quarantine vs. Skip vs. Delete Tests

Quarantining a test is different from skipping or deleting it. 

When you skip or delete a test, you can’t run it, its result won’t be recorded, it cannot block merges, and it provides no data for diagnosis. 

However, when you quarantine a test, you can still run it, record its results, retain its coverage, and get the full data for diagnosis while continuing to merge. You can also remove a test from quarantine after the underlying problem is identified. 

When Should You Quarantine a Test

Every quarantined test is an unresolved problem in your application, so the bar of uarantining test should be based on real issues in the test. Quarantine a test when:

The results are non-deterministic: Quarantine the test if the code remains the same, but the results are different. If it fails consistently, it is a bug report, not a quarantine case.

It has a measurable failure rate: the failure rate between 1% and 5% is a common threshold.

It has actually blocked someone: A test that actually blocks a pull request is more urgent than a test that is not actively blocking anything.

It is not covering something critical: A test that is covering something critical like payment processing, authentication, or data integrity cannot be “saved for later.” You have to fix critical tests urgently. 

If your test suite has a lot of quarantined test cases (more than 2%), there might be a problem with your test architecture.

How to Quarantine Flaky Tests: A Step-by-Step Process

Here’s a step-by-step guide on how to quarantine a flaky test:

Step 1: Detect Flakiness Automatically

Manual flakiness detection does not scale. Here are two reliable ways to catch the flakiness automatically:

1. Repeat runs: Run the same test multiple times against the same commit. Playwright supports this with --repeat-each=5. Most test automation frameworks have an equivalent. Any test that produces mixed results across those runs is flaky by definition. 

2. Historical tracking: Record pass and fail results for every test across every run, then calculate failure rate per test over a rolling window. A test failing 3 out of 100 runs on the same branch is flaky, and you now have a number to point at.

Step 2: Split Your Suite Into Blocking and Non-Blocking Stages

Your test suite and deployment pipeline need two lanes:

1. The blocking stage contains everything that must pass before a merge. This is your required check set. It should be fast, stable, and absolutely trusted. If something in here fails, work stops.

2. The non-blocking stage runs the quarantined tests. It executes on the same commits, produces the same reports, and fails in its own lane without touching merge status. Give the non-blocking stage its own dashboard. Teams that route quarantine results into the same view as everything else tend to lose track of them.

Step 3: Tag or Manifest the Quarantined Tests

You need a machine-readable record of what is quarantined and why. Two approaches are good here:

1. Tagging in code: Add an annotation to the test itself, with structured metadata in the body. See the example below.

@quarantine(

  owner: "priya.n",

  reason: "intermittent timeout on checkout step, ~6% fail rate",

  ticket: "QA-1842",

  expires: "2026-10-15"

) 

As a result, the context lives next to the test, so anyone reading the file knows immediately. 

2. A manifest file: Keep a single file, YAML or JSON, listing every quarantined test with the same fields. Your test runner reads it and routes accordingly. You get one place to look, and you can quarantine without touching test code. 

Step 4: Assign an Owner and Open a Ticket

The owner is a person who is in charge of the test case. Assign the developer who owns the code under test, or who wrote the test, or who touched it last—the rule should be consistent.

Open a real ticket in the system your team actually uses, such as GitHub or any native defect tracker in your test management platform. The ticket should carry the failure rate, a link to a failing run, the suspected cause if anyone has a guess), and the expiry date.

Step 5: Set an Expiry and Enforce It

Every quarantine test entry should have a date. Two weeks is a reasonable default. Longer than a month can lead to delays, and the date should be enforced. Before the entry expires, you should either fix the test and graduate it back or renew the entry if you need more time. Renewals should be capped by a small number so the solution is prioritized.

What Is the Graveyard Anti-Pattern and How to Avoid It

The Graveyard Anti-Pattern occurs when flaky tests are moved into quarantine and then forgotten. Instead of serving as a temporary holding area while issues are resolved, the quarantine becomes a permanent resting place for neglected tests. Over time, test coverage silently degrades, and teams lose visibility into real failure signals.

How the Graveyard Anti-Pattern Develops

Common reasons behind the graveyard anti-pattern are:

1. Quick-fix mentality: Developers quarantine failing tests to unblock builds quickly without opening follow-up tracking tickets.

2. Lack of ownership: Quarantined tests lack assigned owners or clear expiration dates, leaving no one accountable for fixing them.

3. Out of sight, out of mind: Non-blocking execution results are ignored, hiding persistent failures and regressions until major outages occur.

How to Avoid the Graveyard Anti-Pattern

Here’s how to avoid the graveyard anti-pattern:

1. Enforce mandatory metadata: Require every quarantined test to specify an owner, an issue tracker ticket, a specific reason, and an expiration date.

2. Set strict quarantine limits: Cap the total number of quarantined tests (e.g., maximum 5% of the test suite). Require resolving existing quarantined tests before adding new ones once the cap is reached.

3. Automate expiration alerts: Trigger automated notifications or build warnings when a test exceeds its scheduled time in quarantine.

4. Conduct regular triage reviews: Review quarantined tests during weekly engineering syncs to ensure active investigation, graduation, or permanent deletion.

How to Graduate a Test Back Out of Quarantine

Getting a test out of quarantine should be as clearly defined as putting it in. Otherwise, tests either linger indefinitely or get rushed back into the main suite, only to start blocking builds and frustrating the team again.

To prevent premature graduation, establish a strict stability bar. A standard benchmark requires the test to pass 50 consecutive runs in the non-blocking execution lane without a single failure. For tests that were severely flaky, increase this threshold to 100 consecutive green runs before considering them stable.

Here’s how the sequence should go:

1. Fix the root cause, not the symptoms: Avoid quick fixes like adding retry wrappers or extending arbitrary sleep timeouts. Instead, replace static waits with dynamic, event-driven assertions, isolate test data using unique identifiers per test run, ensure proper setup and teardown of environment state, and mock or stub unstable external dependencies. Band-aid fixes merely conceal underlying instability, guaranteeing the test will flake again.

2. Let the fix soak in CI: Keep the test in the non-blocking quarantined lane while it accumulates test runs across various branches and builds. For example, if your CI pipeline executes 20 times per day, completing a 50-run stability requirement will take roughly two to three days. Resist the urge to shortcut this phase by running the test locally in a loop, as local environments rarely replicate the concurrency and network conditions of CI runners.

3. Verify stability against metrics: Review actual build history logs and telemetry rather than relying on gut feeling or memory to confirm that the stability threshold has been reached without intermittent failures.

4. Promote back to the blocking suite: Remove the test from the quarantine manifest or delete its code annotation, close the tracking ticket, and restore the test to the primary blocking stage where failures halt deployment pipelines.

5. Monitor closely post-graduation: Track the test’s performance during its first week back in the blocking suite. If it fails due to flakiness again, return it immediately to quarantine and mark it for rewrite or deletion, as failing multiple graduation attempts indicates fundamental design flaws.

A pro tip: Continuously track two key performance indicators: median quarantine duration and overall graduation rate. If median duration rises, expiration policies are not being enforced effectively. If the graduation rate drops below 50%, it indicates that most quarantined tests should be deleted rather than repaired, saving valuable engineering overhead.

TestFiesta Turns Flaky Test Chaos Into a Queue You Can Actually Clear

Managing flaky tests effectively requires robust tracking and accountability. TestFiesta simplifies this workflow by serving as a centralized platform for test results, historical metrics, ownership, and quarantine statuses.

Here is how TestFiesta streamlines flaky test management from detection to graduation:

  • Automated Tracking & Flakiness Trends: Instead of parsing complex CI logs, TestFiesta automatically gathers failure rates over time and highlights flakiness trends across your runs.
  • Clear Ownership & Expiration Tracking: Quarantined tests are assigned directly to owners and linked with strict expiration deadlines, preventing them from being forgotten in config files.
  • Data-Driven Graduation: When a test is ready to return to the blocking suite, TestFiesta provides verified run history to confirm stability before graduation.

Ready to Take Control of Your Flaky Tests?

Stop letting unreliable tests slow down your deployment pipeline and drain team productivity.

Start your free trial today

FAQs

Does quarantining a test slow down my CI pipeline?

Yes, quarantining a test can slightly slow down your CI pipeline because quarantined tests still run. The delay is usually brief because the non-blocking stage runs in parallel with everything else. 

Can I automate the quarantine process entirely?

Not entirely, but you can automate the quarantine process largely. Detection, routing, and expiry reminders can all be automated. But the decision to quarantine a test and the assignment of an owner should stay manual. 

What if a quarantined test is actually catching a real bug?

Quarantine tests can sometimes actually catch a real bug, and it’s the main risk of quarantining a test. Before quarantining, check whether the failure correlates with specific code changes rather than appearing at random. If the failure rate jumps after a deploy, treat it as a regression first and investigate before routing it to quarantine.
Testing guide
Best practices

Introduction

Imagine this scenario: your web application passes every test, survives staging without a hitch, and gets deployed with complete confidence. Then, within minutes of launching, bug reports start pouring in. A core feature, like submitting a form or completing checkout, is completely broken. The culprit? An oversight as simple as not testing on Safari because your entire team uses Chrome.

This common pitfall highlights why cross-browser testing is essential. Different web browsers don’t interpret code identically, and these discrepancies often surface where they hurt most, in forms, navigation, payments, and layout structures.

Whether you’re launching a new product or maintaining a growing web application, ensuring a seamless experience across all major browsers and devices is crucial for user retention and brand credibility.

This guide covers what cross-browser testing is, how it differs from cross-device testing, how to do it manually, how to automate it, and which tools are worth your time.

What Is Cross-Browser Testing

Cross-browser testing is the practice of checking that a website or web app looks and works as intended across different browsers, browser versions, and operating systems. Cross-browser testing matters because every browser relies on an engine to turn HTML, CSS, and JavaScript into what you see on screen. There are three major engines powering browsers today: Blink, WebKit, and Gecko. Each engine implements web standards on its own schedule and with its own quirks. A CSS property that renders perfectly in Blink (that powers Chrome) can behave differently in WebKit (that powers Safari). A JavaScript API that Chrome shipped months ago might not exist yet in the Safari version your customers are running.

Cross-Browser Testing vs. Cross-Device Testing

Cross-browser testing and cross-device testing are often paired together during QA. While cross-browser testing focuses on the browser, browser versions, and browser engines that render your app, cross-device testing focuses on the hardware your app runs on. It checks how your app behaves on different phones, tablets, laptops, and desktops, each with its own screen size, resolution, input method, operating system version, and processing power. 

The overlap between cross-browser testing and cross-device testing is where most real bugs live. Safari on an iPhone and Safari on a MacBook share the same engine, yet one uses touch, a small viewport, and mobile hardware while the other uses a mouse and a large screen. That's why most teams run cross browser and cross device testing together. Your users don’t experience a browser or a device in isolation. They experience a combination of both.

What Does Cross-Browser Testing Check

Cross-browser testing checks the following areas:

  • Layout and rendering: Layout and rendering includes alignment, spacing, fonts, images, and whether elements overflow or overlap.
  • Core functionality: Core functionality includes forms, buttons, navigation, search, login, and payment flows working end to end.
  • CSS and JavaScript support: CSS and JavaScript support includes features your code depends on actually being available in each browser version. If the code features are not available, the code will not be successful. 
  • Responsive behavior: Responsive behavior ensures pages adapt correctly across viewport sizes and orientations.
  • Input handling: Input handling checks hovering on desktop, touch gestures on mobile, and keyboard navigation.
  • Media: Media verification includes video, audio, and animations playing and displaying as expected.
  • Accessibility: Accessibility includes screen reader behavior and focus handling, which can vary between browser and assistive technology pairings.

How to Do Cross-Browser Testing Manually

Cross-browser testing can and should be automated, but manual testing is the practical choice for new features where the UI is still changing week to week. Here’s how to do cross-browser testing manually:

Step 1: Build Your Browser Testing Matrix

A testing matrix defines exactly which combinations you’ll test. Without a good matrix, coverage depends on whichever browsers testers happen to have open. A B2B dashboard used mostly on company laptops will have a very different browser mix than a consumer shopping app used mostly on phones.

Each row in your matrix should specify the browser, browser version, operating system, and device or viewport. Then assign priority tiers so effort matches risk.

Whatever your analytics say, make sure the matrix covers all three mainstream engines (Blink, WebKit, and Gecko) at least once. Many teams also decide on a version policy up front, such as covering the current and previous major versions of each evergreen browser, so nobody has to debate it every sprint.

Step 2: Set Up Your Test Environments

A test environment is a controlled, isolated setup that mimics real-world conditions to run software tests safely before a product goes live to end-users. You have a few ways to get access to the browsers in your matrix:

  • Local installs: Local installs are fine for Chrome, Edge, and Firefox. Safari only runs on Apple platforms, so you’ll need a Mac for desktop Safari.
  • Virtual machines: Virtual machines are useful for testing different operating systems from one workstation.
  • Emulators and simulators: Emulators and simulators are good for quick layout checks on mobile viewports, but they don’t fully reproduce real hardware, touch behavior, or performance.
  • Real devices: Real devices are the most accurate option for mobile, and the most expensive to maintain in-house.
  • Cloud testing platforms: Cloud testing platforms give remote access to large pools of real browsers and devices without owning any of them.

Whichever mix you choose, keep the environment itself consistent. Test against a staging build that matches production, use stable test data, and clear cache and cookies between sessions so results from one browser don’t leak into the next.

Step 3: Execute Functional and Visual Checks

Run the same set of test cases in every configuration in your matrix. Start with your critical user journeys, such as signup, login, checkout, and core feature workflows, before moving to secondary pages.

For each configuration, work through three layers:

  1. Functional checks: Does every step complete? Do form validations fire? Do error messages appear? Does data save correctly?
  2. Visual checks: Is anything misaligned, clipped, or overlapping? Do fonts and icons load? Does the page look right at different window sizes?
  3. Interaction checks: Do hover menus have a touch equivalent on mobile? Can you tab through the page with a keyboard? Does rotating a device break the layout?

Browser developer tools help a lot here. The console surfaces JavaScript errors that aren’t visible on the page, and the network panel shows failed requests that might only happen in one browser.

Pro tip: Don’t write separate test cases for each browser. Write each test case once and run it against every configuration. Duplicated test cases drift apart over time, and soon you’re maintaining five slightly different versions of the same checkout test.

Step 4: Log, Debug, and Retest

A cross-browser bug report is only useful if a developer can reproduce it. Every report should include:

  • Browser name and exact version
  • Operating system and version
  • Device model or viewport size
  • Steps to reproduce
  • Expected result vs. actual result
  • Screenshots, screen recordings, and console errors

Before logging, check whether the bug appears in other browsers too. If it shows up everywhere, it’s a general defect. If it appears only in Safari, or only in browsers on one engine, that narrows the cause significantly and speeds up the fix.

After the fix ships, retest in the configuration where the bug appeared. Then run a quick regression test on the other browsers in your matrix, because a CSS fix for one engine can easily break the layout in another.

How to Automate Cross-Browser Testing

Cross-browser testing is doable manually, but twenty test cases across five browser configurations means 100 executions per release, and the matrix only grows as you add devices and versions.

Automated cross-browser testing solves the repetition problem. The same script runs against every browser in your matrix, often in parallel, and reports back in minutes. The best candidates for automation are stable, repetitive, high-value flows, including login, checkout, form submissions, and anything you retest on every release. Exploratory testing and visual judgment calls still belong to humans.

If you want to automate cross-browser testing without creating a maintenance headache, it comes down to two decisions: which framework you use and how you schedule your runs.

Step 1: Choose the Right Automation Framework

Four open-source test automation frameworks cover most automated cross-browser testing needs.

1. Selenium is the longest-standing option. It implements the W3C WebDriver standard, works with Chrome, Firefox, Safari, and Edge, and supports multiple languages including Java, Python, C#, JavaScript, and Ruby. 

2. Playwright drives Chromium, Firefox, and WebKit through a single API, and it can also run tests on branded Chrome and Edge. It supports emulated mobile and tablet devices and is available for JavaScript and TypeScript, Python, .NET, and Java. 

3. Cypress is popular with JavaScript teams for its developer experience and interactive test runner. It supports Chrome-family browsers (including Edge) and Firefox, with WebKit support still marked as experimental. 

4. Appium handles the mobile side. It automates native, hybrid, and mobile web apps, including Safari on iOS and Chrome on Android, which makes it the usual pick when your automation needs to reach real mobile browsers.

When choosing, weigh the programming languages your team already uses, the browsers your matrix requires, how the framework fits into your CI pipeline, and how much setup your team can realistically maintain.

Step 2: Run Tests in a Tiered Strategy

Running your full suite on every browser for every commit sounds thorough, but it slows feedback to a crawl. A tiered approach keeps pipelines fast while still catching browser-specific bugs before release:

  • On every pull request: Run a fast smoke suite on a single browser, typically headless Chromium. The goal is quick feedback, not full coverage.
  • On merge to main or nightly: Run the full regression suite across all three engines: Chromium, Firefox, and WebKit.
  • Before release: Run the complete matrix, including real mobile devices through a cloud platform, and pair it with a manual exploratory pass on your Tier 1 browsers.

Pro tip: First, run tests in parallel wherever your framework and infrastructure allow it, since sequential runs across many browsers get slow fast. Second, deal with flaky tests immediately. A test that fails randomly in Firefox trains the team to ignore Firefox failures, and that’s how real bugs slip through.

Cross-Browser Testing Tools Worth Knowing

Cross-browser testing tools fall into two groups that work together: Frameworks that write and run your tests, and cloud platforms that provide the browsers and devices to run them on.

Open-Source Cross-Browser Testing Tools

Selenium, Playwright, Cypress, and Appium are the core open-source options. They’re free to use, backed by large communities, and give you full control over your test code. 

Cloud Cross-Device Testing Tools

Cloud platforms remove the infrastructure burden. Instead of maintaining a device lab, you point your existing tests at a remote grid.

  • BrowserStack offers manual cross-browser testing through Live, browser automation through Automate, and real device testing through App Live and App Automate, plus Percy for visual testing. 
  • Sauce Labs combines a virtual device cloud, which it says covers more than 3,000 browser and OS combinations, with a real device cloud of physical iOS and Android devices. 
  • TestMu AI has cross-browser testing, a real device cloud, and automation capabilities, along with AI agents for test authoring and orchestration.

Manage Your Cross-Browser Test Coverage in One Place With TestFiesta

Cross-browser testing tools tell you if the test passes on a particular browser, but they don’t tell you exactly how many test cases you’ve run on Safari this cycle, whether what failed on Firefox is still open, and if anyone tested the checkout on Android.

Those answers usually live in a spreadsheet that keeps falling out of date with every new test. TestFiesta gives your test case a proper home and your team proper traceability.

Test Once, Run Across Every Configuration: TestFiesta’s Configurations let you define a test case once and execute it across multiple browsers, devices, and environments without duplicating it. When a test changes, you update it in one place, and results stay organized by environment so you can see exactly what passed where.

Reuse Instead of Rewriting: Shared steps and templates cut the repetitive work of building out a large test suite, which matters when the same login steps appear in dozens of test cases.

Track Bugs Where You Find Them: Built-in bug tracking ties every bug to the exact test and execution that found it. Attach the screenshots, logs, and browser details a developer needs, and assign defects without switching tools. If your team lives in Jira or GitHub, TestFiesta integrates with both.

See Manual and Automated Results Together: TestFiesta’s automation API lets you feed results from your automated runs into the platform, giving you a single view of manual and automated outcomes across your whole browser matrix.

Pricing That Doesn’t Punish Coverage: TestFiesta offers an Organization plan at $10/user/month with every feature included and billing based on active users. There’s a 14-day free trial with no credit card required.

Don’t let undetected browser bugs affect your user experience.

Take control of your testing matrix and keep test results unified in one powerful dashboard with TestFiesta.

Start your free trial today

FAQs

Does Cross-Browser Testing Include Mobile Browsers?

Yes, cross-browser testing also includes mobile browsers like Safari on iOS, Chrome on Android, and Samsung Internet, so they should be part of your testing matrix, especially if a large share of your traffic comes from phones. 

What’s the Difference Between Cross-Browser Testing and Compatibility Testing?

Compatibility testing is the broader practice of checking that software works across different operating systems, hardware, networks, and software environments. Cross-browser testing is one part of compatibility testing that focuses specifically on browsers, browser versions, and rendering engines. 

How Many Browsers Should I Test My Website On?

There’s no universal number of browsers that you should test your website on. Start with your own analytics and cover the browsers that make up most of your traffic. Major ones include Chrome, Safari, FireFox, and Brave.

Testing guide

Introduction

Testing as the last checkpoint is one of the most common practices in the traditional development processes. After a long sprint, testing usually takes a back seat and is pushed to the end, which results in poor, urgent testing and delayed regression cycles. 

Shift-left testing is a philosophy that focuses on improving testing and including it in the process from the get-go. In this guide, we’ll cover shift-left testing in detail, along with its four variants, how it fits into your sprint, which tools you need, and which mistakes to avoid. 

What Is Shift Left Testing

Shift-left testing refers to starting the testing activities as early as possible in the software development lifecycle rather than saving them for the end. The name “shift-left” comes from how development timelines are drawn. 

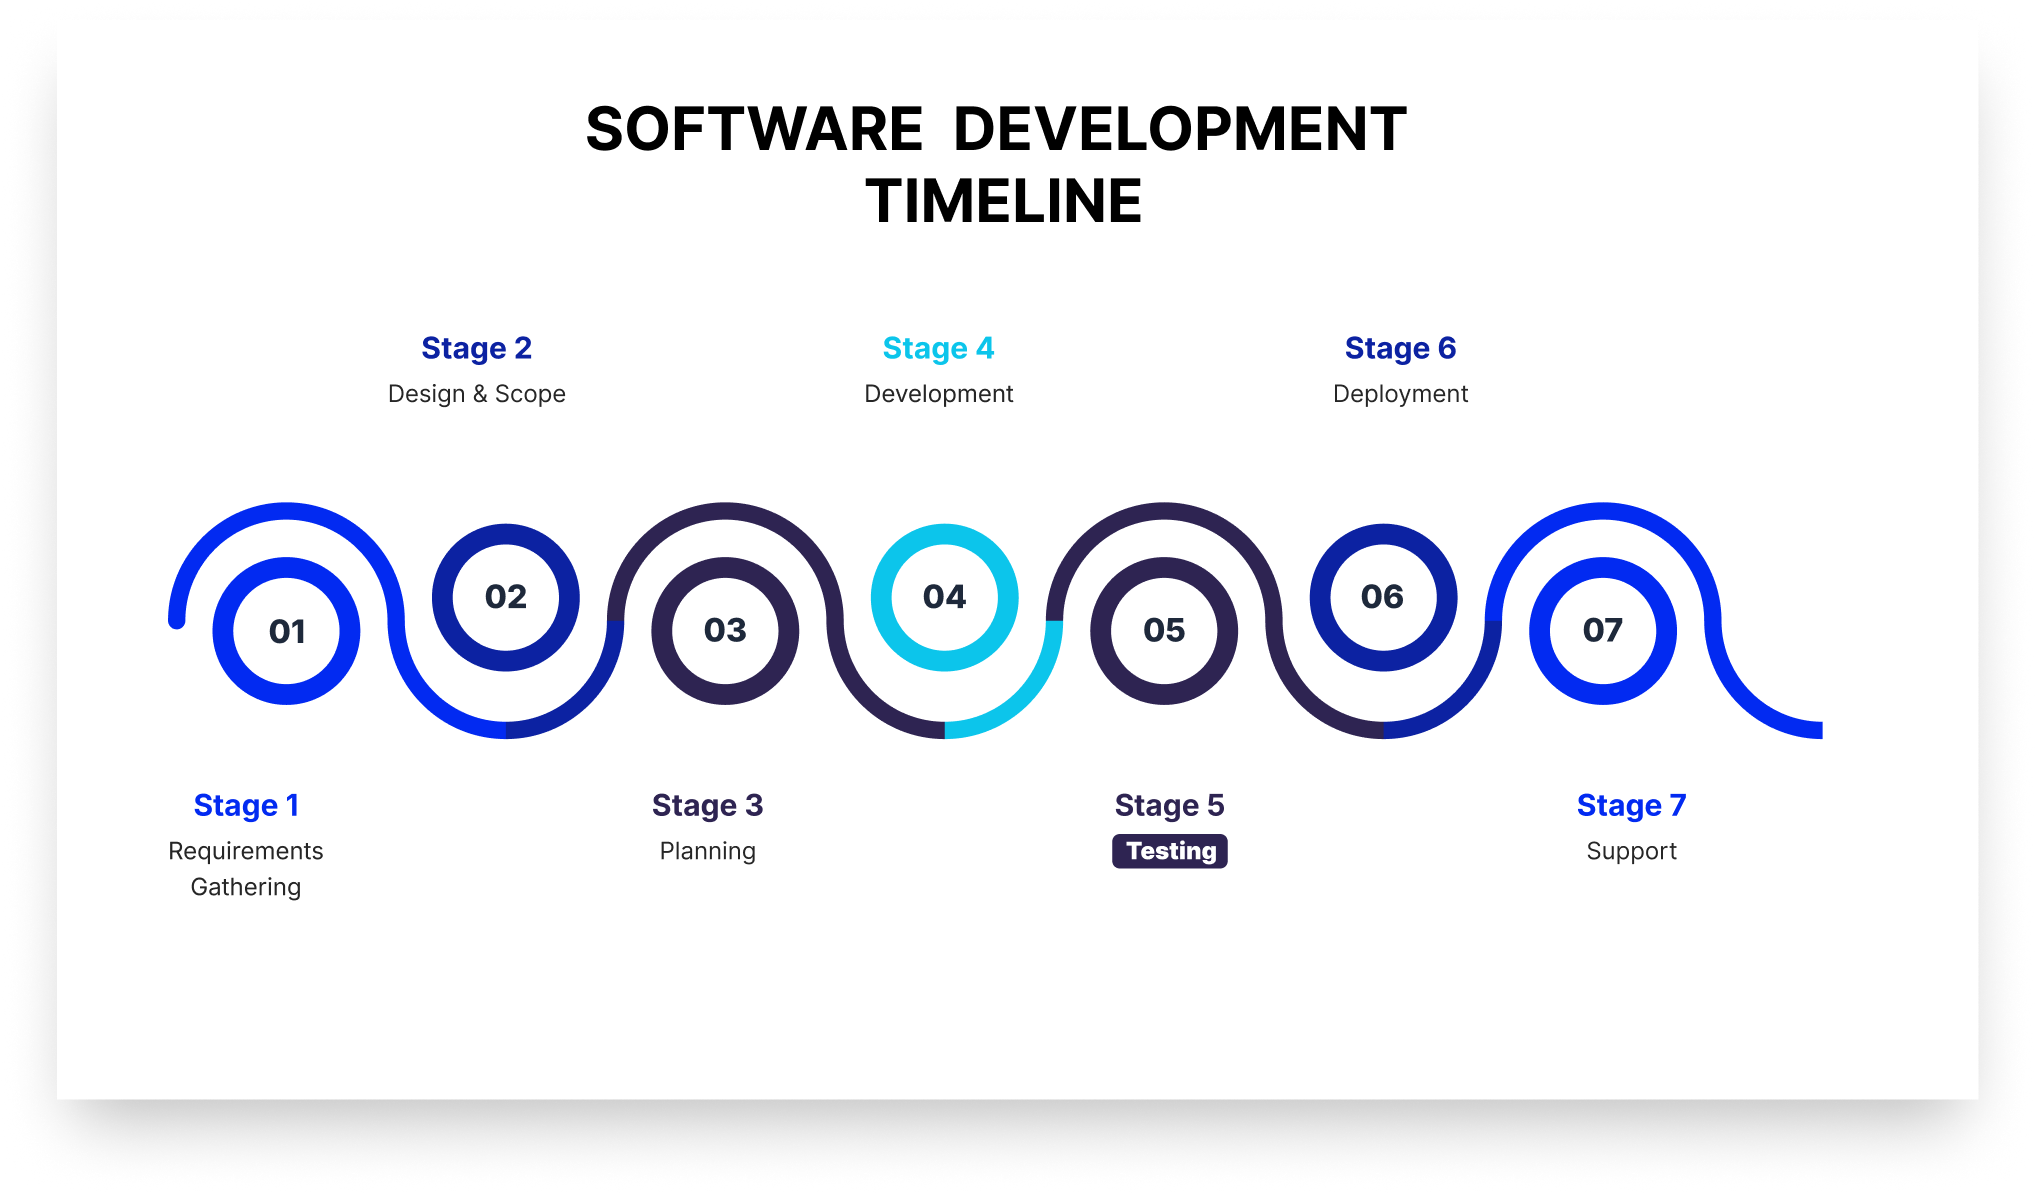
In the development chart, requirements sit on the left, production on the right, and testing has traditionally lived near the right edge (as visible in the picture below).

The software development timeline chart or the software development life cycle.

 “Shifting left” moves testing toward the beginning of that line, so it runs simultaneously with the other stages of the development process. 

A core benefit of shift-left testing is covers activities that prevent defects from being written at all. It reviews requirements for testability and defines acceptance criteria before a test is written. As a result, a defect caught in a requirements review never becomes code, saving time for developers. 

How Shift Left Testing Is Different From Traditional Testing

The difference between traditional testing and shift-left testing is not just about the tools you're using. It's more about how and when the QA will be involved in the product development. The table below shows the difference between shift-left testing and traditional testing in various aspects.

Traditional testing Shift left testing
When testing starts After development completes At requirements and design
Who owns quality The QA team Developers, QA, and security together
Feedback loop Days to weeks Minutes to hours
What triggers a test run A release candidate or handoff A commit or pull request
Defect discovery point Test phase or production Design, commit, or PR review
QA's primary role Finding defects Preventing them, plus deep exploratory work

The 4 Types of Shift Left Testing

Here are four common variants or types of shift-left testing that most agile teams follow:

1. Traditional Shift Left

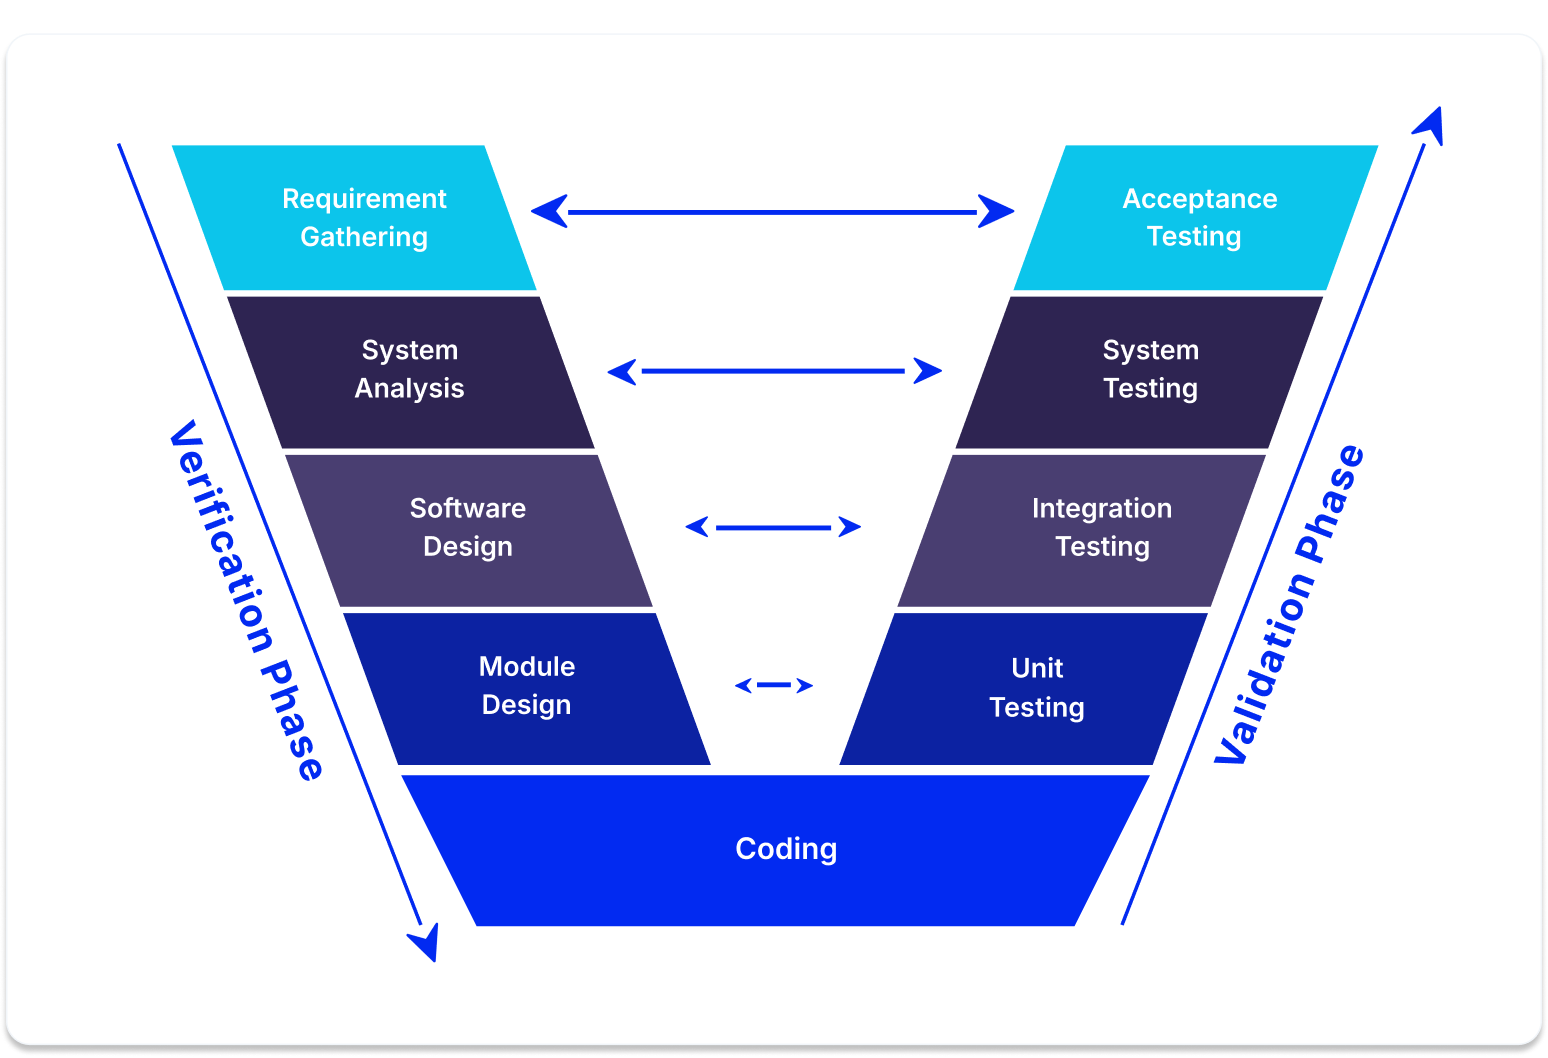
Traditional shift-left testing moves testing down and slightly left on the V model (see the image below). 

The V model in software testing

The V-Model is a step-by-step blueprint for building and testing software where every single development phase has a matching testing phase. It gets its name because the process bends upward after the coding stage, making the shape of the letter V.

It’s the type most people visualize when they talk about shift-left testing. For instance, if your team performs unit tests and integration tests early on, you’re doing traditional shift-left testing. 

2. Incremental Shift Left

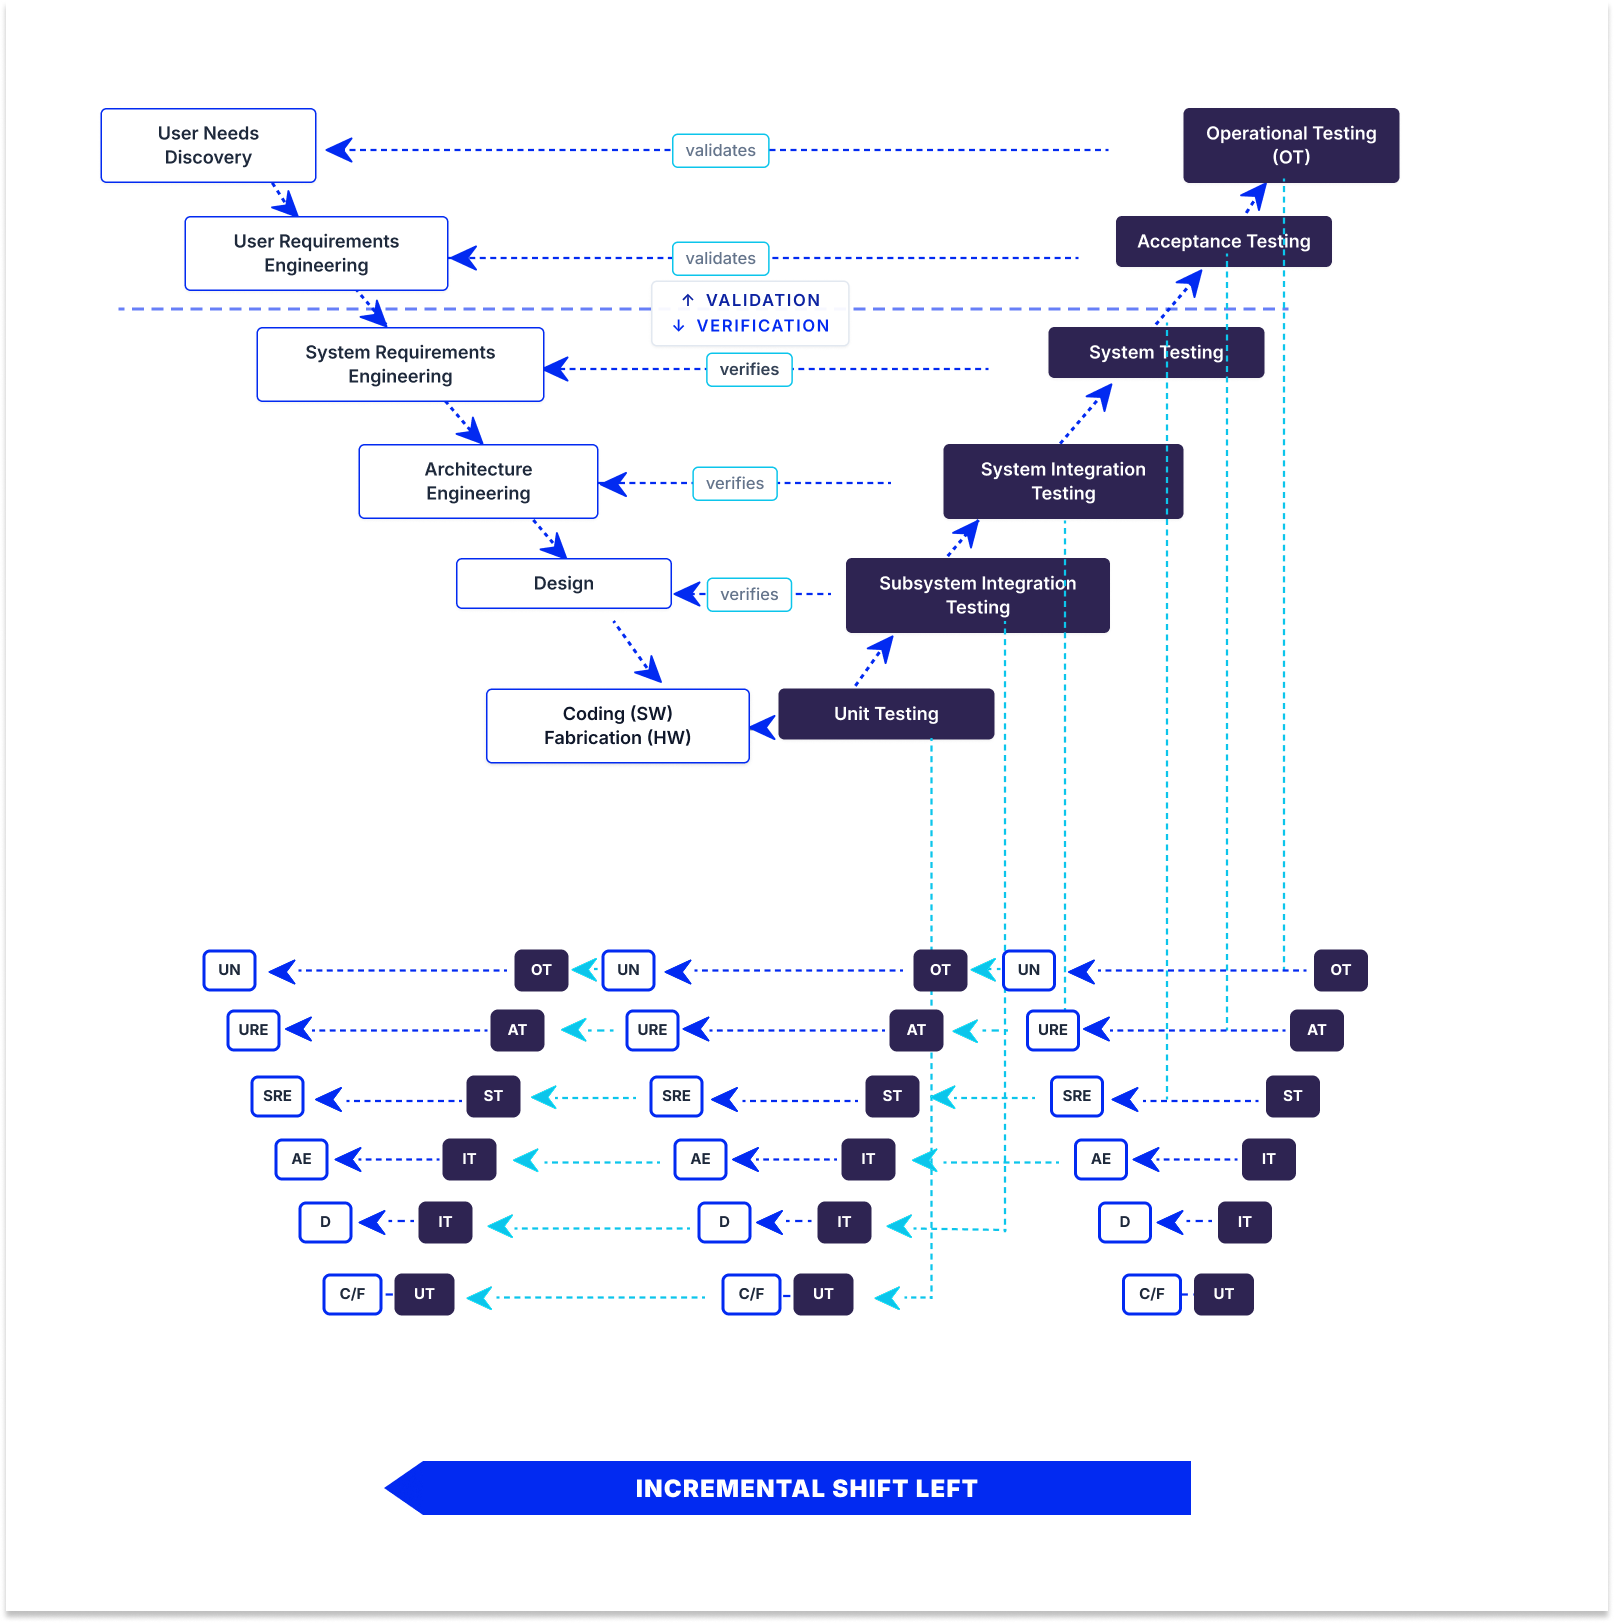
In incremental shift-left testing, the testing project breaks into smaller increments, each with its own V model (see the picture below). 

 Incremental shift-left testing where the V model breaks into smaller V models.

As a result, testing happens per increment rather than only once at the end. When each increment ships, developmental and operational testing shift left together. This is popular for large, complex systems with substantial hardware components, where you can’t test the whole system at once but can validate each subsystem as it’s built.

3. Agile/DevOps Shift Left

In Agile/DevOps shift-left testing, testing happens inside short sprints. Each sprint contains its own development and testing work. This means automated tests are triggered whenever there’s a code change in the CI/CD pipeline, so developers get the feedback the same day they change the code. 

4. Model-Based Shift Left

Model-based shift-left testing tests your model instead of code. It tests executable requirements, architecture, and design models, so testing begins almost immediately without waiting for code. The primary benefit of model-based shift-left testing is that you can catch requirements and expensive design defects. The catch is that model-based shift-left testing requires formal, executable models, which is why there is not a large adoption of this approach. 

Why DevOps Recommends Shift-Left Testing Principles

DevOps recommends shift-left testing principles for four reasons:

1. CI/CD pipelines require quality gates at every stage: A pipeline is a series of automated decisions about whether a change can proceed. If the only real check sits at the end, the pipeline isn’t deciding anything but only moving code toward one manual gate. Every stage needs its own criteria, including build, unit tests, static analysis, integration tests, and security scans.

2. Continuous deployment can’t wait for a manual QA cycle: If you deploy several times a day and your regression cycle takes three days, manual testing doesn’t work. If you stick to manual QA instead of automation, either deployment frequency drops to match testing or testing gets skipped. 

3. Shared quality ownership aligns with DevOps culture: DevOps dissolves the wall between development and operations. Leaving the “wall” of testing standing between development and QA reintroduces the same problem that DevOps tries to solve.

4. Faster feedback loops reduce context switching: A developer who gets a test failure immediately after pushing the change is still holding it fresh in their head, as opposed to someone who gets it later and has to find the context again.

How Does Automated Shift Left Testing Work

Automated shift-left testing relies on running fast and inexpensive checks early in the development process. It saves slow and expensive tests for later stages when code is more stable. 

The process starts at the pre-commit stage, where quick scans catch basic issues, such as formatting problems and leaked passwords. Next, when code is submitted for review, the system runs thorough unit tests and security checks within minutes. If anything fails at this review stage, the code cannot be merged into the main project. 

After merging, deeper integration checks and container scans run to ensure different parts of the system work together. Finally, comprehensive performance and end-to-end tests are run before the software is released to the public. Splitting tests into these distinct stages keeps the process fast so developers actually use it.

Mistakes to Avoid When Automating for Shift-Left Testing

When implementing automated shift-left testing, avoid these common pitfalls:

  • Writing tests after the fact: Tests written after code exists only confirm current behavior, including bugs, rather than validating requirements. Write tests from acceptance criteria to catch actual defects.
  • Slow test suites: Tests taking longer than 10 minutes force context switching as developers change tasks. Parallelize, stage tests, and trim low-value checks to keep runs fast.
  • Lack of ownership model: Clearly define who writes unit tests, maintains integration suites, and fixes broken pipelines. Without clear ownership, test suites decay and flaky tests get ignored.
  • Focusing on line coverage over defect escape rate: High line coverage does not guarantee meaningful assertions. Track the defect escape rate to measure true effectiveness.

Shift Left Testing Benefits

Adopting shift-left testing offers important organizational and operational benefits, including:

  • Lower defect cost: Bugs identified early in development are substantially cheaper and simpler to resolve than those discovered in production.
  • Faster release cycles: Continuous quality checks eliminate long stabilization periods prior to deployment.
  • Fewer production defects: Early checks catch architecture and requirements flaws before code reaches end users.
  • Shorter feedback loops: Developers address feedback immediately while context is still fresh.
  • Security cost reduction: Catching vulnerabilities during review avoids costly post-release incident response and patches.
  • Better collaboration: Early QA involvement fosters shared quality ownership across engineering teams.

Shift Left Testing Tools Worth Knowing in 2026

Effective shift-left testing relies on a modern toolkit tailored to every phase of the development lifecycle. Here are the top tools and frameworks essential for implementing shift-left testing in 2026:

Static Analysis and Secret Scanning

SonarQube: Analyzes source code for bugs and security vulnerabilities, enforcing quality gates directly on pull requests.

Semgrep: Lightweight static analysis using custom, code-like rules for fast feedback during development.

TruffleHog & Gitleaks: Scan repositories and commit histories via pre-commit hooks to catch secrets and API keys before they are pushed.

Unit and Integration Testing

JUnit, pytest & Jest: Essential unit testing frameworks for Java, Python, and JavaScript to build fast, automated test suites.

Testcontainers: Provides throwaway Docker instances for databases and services, removing shared-environment bottlenecks during integration tests.

API and Contract Testing

Postman & Newman: Enables teams to author API tests in a GUI and execute them automatically in CI/CD pipelines.

Pact: Facilitates consumer-driven contract testing to verify microservices independently without full deployments.

Dependency and Container Security

Snyk automatically scans third-party dependencies for vulnerabilities and opens automated pull requests for fixes.

Trivy: Fast open-source scanner for container images, filesystems, and infrastructure as code.

Trivy is an open-source scanner covering container images, filesystems, and infrastructure as code, fast enough to sit inside a build without slowing it down.

CI/CD Orchestration

GitHub Actions, GitLab CI & Jenkins: Automate and orchestrate pipeline stages, enforcing quality gates before code merges.

Shift Left vs. Shift Right Testing: What’s the Difference

Shift-left testing moves testing (left) earlier in the process, alongside or even before development. Shift-right testing moves testing (right) later into the process, into the production environment, with real data. 

The entire concept of shift-right testing is that some defects cannot be truly uncovered before real users hit real infrastructure, so it tests on actual traffic patterns, third-party behavior under load, and edge cases. 

TestFiesta Gives Your Shift Left Strategy Somewhere to Land

Shift-left testing aggregates results across multiple systems (CI unit tests, post-merge contract tests, PR security scans, and sprint exploratory sessions), often making release readiness difficult to track.

TestFiesta consolidates these sources into a single view by ingesting automated CI pipeline results alongside manual and exploratory test outcomes through its Automation API.

Reusable configurations allow test cases to execute across multiple browsers, devices, and environments without duplication, while shared steps centralize common workflows like login or checkout to streamline suite maintenance.

Built-in defect tracking connects failures directly to test executions. Integrations with Jira and GitHub automatically sync fields, update statuses, and create context-rich issues from failed runs.

Organizations use folders, tags, and custom fields to map automated run data. Pricing is a flat $10 per user per month with all features included.

Ready to Elevate Your Shift-Left Testing Strategy?

Streamline your quality workflow, centralize your test results, and empower your team to ship faster with confidence.

Start your free trial today

FAQs

Does shift-left testing mean developers replace QA engineers?

No, shift-left testing does not mean that developers replace QA engineers. It changes what QA spends time on. Repetitive testing is automated, and developers write tests alongside their code, while QA moves toward work that requires critical judgment, such as reviewing requirements for testability, designing test strategy, exploratory testing, and owning the quality signal. 

How do you measure whether shift-left testing is actually working?

To measure whether shift-left testing is actually working, you should track essential software testing metrics, including defect escape rate, the percentage of defects found in production rather than before release, mean time to detect, and pipeline duration, since a slow pipeline gets bypassed. 

What’s the difference between shift-left testing and test-driven development (TDD)?

Shift-left testing is a broad strategy that moves all quality activities, including requirements reviews, static analysis, and security scans, earlier in the development process. Test-driven development (TDD) is just one specific practice within that broader strategy, where you write a failing test before writing the code to pass it and refactor the results. Simply put, you can practice shift-left testing without using TDD, but you cannot do TDD without shifting left.

Testing guide
Best practices

Introduction

Manual and automated testing are essential for catching bugs and regressions and ensuring the core functionality of the product works as expected. But even when all tests pass, users can still run into unexpected bugs right away. That’s because both manual and automated tests are scripted, and they only check for issues that were written down ahead of time. Exploratory testing is different; it’s unscripted. 

What Is Exploratory Testing

Exploratory testing is an approach to software testing where testers simultaneously learn about the application, design test cases, and execute them. Unlike traditional scripted testing, which relies on pre-written, step-by-step test plans, exploratory testing encourages testers to rely on their intuition, domain knowledge, and critical thinking to discover defects that structured tests might miss.

Say you are testing the checkout. The scripted test adds an item, enters a valid card, and confirms the order is completed. It passes. In contrast, an exploratory tester adds the item, opens a second tab, removes it from the cart there, then returns to the first tab and pays. That test was not written because nobody thought of it until they were sitting in front of the product with two tabs open.

That said, exploratory testing can be as disciplined as any other intellectual activity, and its quality depends heavily on the tester’s skill. 

Exploratory Testing vs. Ad Hoc Testing

Both ad hoc and exploratory testing are two types of unscripted testing, but they are not the same. Ad hoc testing is informal, unplanned, and leaves no record of what was covered, making it unstructured and unaccountable. In contrast, exploratory testing is unscripted but structured and accountable, following a specific mission, a defined block of time, and detailed notes so you can track exactly what was tested and discovered.

When Should You Use Exploratory Testing

Exploratory testing pays off most where writing test cases first would be impossible or wasted, including the following cases.

  • When requirements are thin or still moving: If the requirements are thin, there is nothing to write detailed cases from. Exploring the feature is a better option in that case.
  • On brand-new features: Brand-new features should be explored after they are shipped because that allows the team to verify the functionality of what was actually shipped.
  • Around bug fixes and risky changes: Areas around risky changes and bugs should be explored because they are critical in nature.
  • Before a release, in the gaps: Automated suites cover the expected paths. A focused exploratory session covers the paths that nobody thought of.
  • On usability and real-world flows: A test case can confirm a button works. It cannot tell you that the flow takes eleven clicks, and the error sits below the fold. That’s something exploratory testing can confirm.

Types of Exploratory Testing

There are a few ways to perform exploratory testing, including:

1. Freestyle Exploratory Testing

Freestyle exploratory testing doesn’t have any rules, charter, or coverage target. It’s useful when you need to get familiar with an application quickly, verify another tester’s work, investigate a defect, or run a fast smoke check.

2. Scenario-Based Exploratory Testing

Scenario-based exploratory testing is built around realistic user scenarios. Testers mimic how people actually use the system, explore different paths within a scenario, and watch for breakdowns in the flow. It’s more structured than freestyle and well suited to new features with a clear user journey.

3. Strategy-Based Exploratory Testing

Strategy-based exploratory testing is guided by an overarching strategy, with testers applying established software testing techniques such as boundary value analysis, equivalence partitioning, risk-based testing, and error guessing. Experienced testers tend to be most effective here because the technique supplies structure while judgment decides where to aim it.

4. Session-Based Test Management (SBTM)

Session-based test management (SBTM) is a formal framework rather than a loose style. Testing is organized into time-boxed sessions with charters, reports, and debriefs. 

5. Pair Testing

Pair testing involves two people at one machine, one driving and one observing. It’s slower on raw coverage, but the observation catches what the driver misses.

6. Bug Hunts

Bug hunts refer to a focused group session, often including people from outside QA, aimed at one area for a fixed window. It’s beneficial because it gets fresh eyes on a product.

How to Do Exploratory Testing: Step by Step

The steps below follow session-based test management, the most widely used framework for running exploratory testing in a way you can report on. 

Step 1: Write a Testing Charter

A charter is a short statement of what the session is for. It sets direction without prescribing steps. Charters are created before testing starts, can be changed or updated at any time, and are often built from a specification, a test plan, or the results of earlier sessions. 

Step 2: Time-Box the Session

Set an explicit time limit before you begin, typically 60 to 90 minutes. Time-boxing prevents fatigue, keeps testing focused on the charter, and makes session results easier to schedule and compare across team members.

Step 3: Explore and Take Notes in Real Time

During the session, testers execute tests actively guided by the charter while maintaining the flexibility to follow unexpected leads, explore interesting side paths, and adapt based on real-time observations and critical judgment.

As you explore, record concise notes in real time to capture essential details without interrupting your cognitive flow. Key areas to document include coverage and paths, environment and setup, key decisions and questions, Anomalies, and observations.

Maintaining consistent, high-quality notes ensures the session is transparent and fully reproducible for the post-session debrief, striking a balance between lightweight logging and clear accountability.

Step 4: Investigate Anomalies Deeper

When you encounter unexpected behavior, edge cases, or potential defects during a session, pause to investigate and isolate the anomaly. Verify whether the behavior is consistently reproducible, determine the specific trigger conditions or environmental factors, and assess its severity. However, maintain a balance with your time box. 

If an issue requires prolonged root-cause analysis or extensive log diving, note the initial details and park it for dedicated investigation after the session so you don’t exhaust your remaining session time.

Step 5: Debrief and Document Findings

Once the time-box expires, hold a short debrief session (typically 5 to 15 minutes) with a lead, peer, or product owner. Review the session notes, charter coverage, time allocation (split across test execution, bug investigation, and setup), and key observations. 

Log all confirmed bugs into your tracking system with full reproduction steps, logs, and screenshots attached. Finally, evaluate whether any impactful exploratory paths or discoveries should be converted into automated regression test cases or future testing charters.

Advantages and Limitations of Exploratory Testing

Exploratory testing offers high flexibility and rapid bug discovery, though it requires skilled testers and disciplined documentation to maintain accountability. Here are some notable advantages and limitations of exploratory testing:

Advantages of Exploratory Testing

  • Finds unscripted defects that traditional test cases miss.
  • Requires zero upfront test preparation, ideal for rapidly changing features.
  • Adapts immediately in real-time to focus on newly uncovered risks.
  • Builds domain and product knowledge quickly to improve future scripted tests.
  • Leverages human intuition to evaluate usability and end-to-end user flows.
  • Provides high flexibility, allowing test charters to shift with daily priorities.

Limitations of Exploratory Testing

  • Lacks heavy documentation, which can reduce traceability and test reproducibility.
  • Relies heavily on individual tester skill, leading to inconsistent coverage across team members.
  • Prone to tester bias, as individuals often gravitate toward familiar product areas.
  • Difficult to quantify or prove test coverage without strict session logging.
  • Session metrics can easily skew due to reporting discrepancies or productivity variations.
  • Cognitively demanding, typically limiting testers to a few high-quality sessions per day.

Most of these limitations stem from documentation and management challenges rather than exploration itself, issues that proper tooling can easily resolve.

How TestFiesta Helps Turn Exploratory Testing Results Into Clarity

The hard part of exploratory testing is what happens after: proving what got covered, keeping findings attached to the work that produced them, and making sure good ideas from a session do not evaporate. TestFiesta can help.

Built-In Bug Tracking: TestFiesta has native bug tracking inside the platform, so a defect found mid-session is logged without leaving the test flow, with screenshots and logs attached. Every defect links to the exact test execution that found it, which keeps the context alive forever.

Organized Sessions: Flexible tagging covers cases, runs, users, milestones, and defects, so you can slice reports by feature, risk, sprint, or team without a rigid folder hierarchy. That is how a charter-per-area approach stays readable even after many sessions.

Permanent Coverage: When a session uncovers a path worth checking every release, AI test case creation generates structured cases with steps, expected results, and tags from your requirements or a prompt, and shared steps let you define reusable flows like login or checkout once and reference them everywhere. The discovery becomes a regression test instead of a note someone loses.

Manual and Automated Results Live Together: The automation API feeds automated results into the same platform, so exploratory findings and automated coverage appear in one view. Jira and GitHub integrations auto-map fields and keep requirements, bugs, and coverage aligned, so a bug found during exploration reaches the developer with full context attached.

Every feature is included at one flat price of $10 per user per month, with no tiers and no feature gates.

Streamline your QA workflow and stop letting valuable testing insights slip through the cracks.

With TestFiesta, you get an all-in-one platform built for modern testing teams.

Start your free trial today

FAQs

Is exploratory testing the same as manual testing?

No, exploratory testing is not the same as manual testing. Manual testing is often scripted and describes how a test is run by a person rather than a machine. Exploratory testing describes how a test is designed in the moment rather than in advance. Exploratory testing is a form of manual testing, but not all manual tests are exploratory.

Can exploratory testing be automated?

No, exploratory testing cannot be automated since it depends on a person deciding what to try next instead of relying on automation frameworks and scripts. However, certain tools can make exploratory testing easier. 

How do you measure the effectiveness of exploratory testing?

You can measure the effectiveness of exploratory testing through detailed session reports, which can include sessions per testing area, time spent on test design, bug investigation, and setup. 

Testing guide

Introduction

Security is often treated as the final gatekeeper in the development lifecycle, but waiting until the end is a recipe for disaster. From broken access control to supply chain vulnerabilities, modern applications face constant threats. 

If you’re wondering which tools actually move the needle, you’re in the right place. We’ll explore security testing in detail, including the seven main types of security testing, actionable strategies for CI/CD integration, and the tools that matter most for today’s engineering teams.

What Is Security Testing in Software

Security testing is the practice of checking an application for weaknesses that an attacker could exploit to steal data, gain access they should not have, disrupt service, or abuse functionality. It covers the code, the running application, the third-party components it depends on, and the infrastructure it runs on.

Unlike functional testing, where you verify expected behavior against a spec, security testing spends most of its time on unexpected behavior. The tester’s job is to send inputs the developer never planned for and see what breaks.

What Security Testing Actually Tests For

The specifics vary by application, but most security testing targets the same core categories of weakness:

  • Unauthorized access to data or functionality. Broken access control is the most common serious flaw in web applications. It shows up when a regular user can view another user’s records by changing an ID in the URL or calling an admin endpoint that the UI never exposed.
  • Injection flaws. SQL injection, command injection, and cross-site scripting (XSS) all happen when untrusted user input reaches a sensitive operation without proper handling. A search box that passes its value straight into a database query is a textbook example.
  • Authentication and session weaknesses. Weak password policies, missing rate limiting on login, session tokens that never expire, and predictable password reset links all give attackers a way in through the front door.
  • Vulnerable open-source dependencies. Modern applications pull in hundreds of third-party packages. If one of them has a known CVE and you are running the affected version, the vulnerability is yours regardless of how clean your own code is.
  • Sensitive data exposure. Weak or missing encryption, secrets committed to source control, and misconfigured storage buckets left readable by the public all fall here.
  • Logic flaws. These are the hardest to catch with tools because nothing is technically broken. A checkout flow that lets a user edit the discount field in the request and set it to 100 percent works exactly as coded. It’s just coded wrong.

The 7 Types of Security Testing and What Each One Catches

No single testing type covers all bugs. Here are seven types of security testing, along with what each one catches.

1. SAST: Static Application Security Testing

SAST tools analyze source code, bytecode, or binaries without running the application. They trace how data flows through the code and flag patterns that match known vulnerability classes, such as user input reaching a SQL query without sanitization.

What SAST catches: Injection flaws, hardcoded secrets, insecure cryptographic calls, and unsafe function use, all before the code is ever deployed.

Where SAST falls short: SAST cannot see runtime configuration, environment issues, or how components behave when connected. It also tends to produce false positives because it reasons about what code might do rather than observing what it actually does.

When to run SAST: In the Integrated Development Environment (IDE) and on every pull request (PR). This is the earliest possible point to catch a problem, which makes it the cheapest.

2. DAST: Dynamic Application Security Testing

DAST tools test the running application from the outside, the same way an attacker would. They crawl the app, send crafted requests, and analyze responses for signs of vulnerability. They have no access to source code.

What DAST catches: Server misconfigurations, missing security headers, authentication problems, and injection flaws that only appear when the full stack is running.

Where DAST falls short: DAST cannot tell you which line of code caused the problem, only that the problem exists. It also struggles with single-page apps and complex authentication flows unless configured carefully.

When to run DAST: Against a staging environment on a schedule or before release. It needs a deployed application to work.

3. IAST: Interactive Application Security Testing

IAST places an agent inside the running application and watches how code behaves as tests exercise it. It combines SAST’s visibility into code with DAST’s view of real runtime behavior.

What IAST catches: Vulnerabilities in code paths that your existing functional or integration tests actually reach, with precise line-level detail and far fewer false positives than SAST alone.

Where IAST falls short: IAST only sees the code that gets executed. If your test suite never touches a feature, IAST never looks at it. It also requires language-specific agents, so coverage depends on your stack.

When to run IAST: During QA and integration testing, where automated test suites already drive the application.

4. SCA: Software Composition Analysis

SCA scans your dependency manifest and lock files, identifies every third-party package and its version, and checks them against vulnerability databases. Many tools also flag license issues.

What SCA catches: Known CVEs in open-source libraries, outdated packages, and transitive dependencies you did not know you were pulling in.

Where SCA falls short: SCA only knows about disclosed vulnerabilities. A zero-day in a package you use will not show up until it is published. It also cannot tell you whether your application actually calls the vulnerable function.

When to run SCA: On every build. Dependency vulnerabilities are disclosed daily, so a clean scan last week means nothing today.

5. Penetration Testing

Penetration testing is a human-led attack simulation. A skilled tester, either internal or from a specialist firm, is given a scope and a time window and tries to compromise the application using the same techniques a real attacker would.

What penetration testing catches: Business logic flaws, chained vulnerabilities where several low-severity issues combine into a serious one, and anything that requires understanding what the application is for rather than just how it is built.

Where penetration testing falls short: It is expensive, point-in-time, and limited by the tester’s skill and the scope they were given. A pen test in March says nothing about code shipped in April.

When to run penetration testing: Before major releases, after significant architecture changes, and on a regular cadence (often annually) for compliance requirements.

6. API Security Testing

APIs are now the primary attack surface for most applications, and they fail differently from web UIs. There is no client-side validation to rely on, and object-level authorization flaws are easy to introduce and hard to spot in a UI walkthrough.

What API testing catches: Broken object-level authorization (one user accessing another user's resources by ID), excessive data exposure where endpoints return more fields than the client needs, missing rate limiting, and mass assignment flaws.

Where API testing falls short: Most API testing depends on having an accurate API specification. Undocumented or shadow endpoints are missed entirely.

When to run API testing: Alongside DAST and as part of API contract testing in the pipeline.

7. Vulnerability Scanning

Vulnerability scanning is the broadest and shallowest layer. Scanners check servers, containers, networks, and cloud configurations against databases of known weaknesses: unpatched software, open ports, default credentials, and insecure settings.

What vulnerability scanning catches: Infrastructure and configuration issues that sit underneath the application.

Where vulnerability scanning falls short: Scanners are signature-based. They find known issues and miss novel ones, and they do not understand your application logic at all.

When to run vulnerability scanning: Continuously against production infrastructure and on every container image before it ships.

The OWASP Top 10: Your Security Testing Starting Point

The Open Worldwide Application Security Project (OWASP) Top 10 is the most widely referenced list of web application security risks. It maps each category to specific Common Weakness Enumerations (CWEs), which makes it directly usable as a test planning checklist.

Here’s the OWASP Top 10 checklist:

  1. A01 Broken Access Control. A01 signals users accessing data or performing actions they should not. OWASP’s data shows an average of 3.73 percent of tested applications had at least one weakness in this category.
  2. A02 Security Misconfiguration. A02 refers to default settings, debug mode left on, open storage buckets, and missing security headers. 
  3. A03 Software Supply Chain Failures. A03 covers dependency confusion, malicious packages, and tampered build pipelines, not just outdated libraries. OWASP notes that it had the fewest occurrences in test data but the highest average exploit and impact scores.
  4. A04 Cryptographic Failures. A04 includes weak or missing encryption of sensitive data, both at rest and in transit.
  5. A05 Injection. A05 refers to SQL injection, command injection, and XSS. 
  6. A06 Insecure Design. A06 includes flaws baked into the architecture before a line of code is written. No amount of secure coding fixes a design that never considered threat modeling.
  7. A07 Authentication Failures. A07 refers to weak login, session handling, and identity management.
  8. A08 Software and Data Integrity Failures. A08 includes unverified updates, insecure deserialization, and CI/CD pipelines that trust code without verifying it.
  9. A09 Security Logging and Alerting Failures. A09 refers to problems where you were breached and never knew. Insufficient logging means incidents go undetected for months.
  10. A10 Mishandling of Exceptional Conditions. A10 refers to applications that fail open, leak stack traces, or behave unpredictably when they hit an edge case.

For a team starting security testing from scratch, the practical move is to map each category to the testing type that catches it. 

SAST and SCA cover A03, A04, A05, and A08. DAST and vulnerability scanning cover A02 and A07. API testing and penetration testing are your best bet for A01 and A06. A09 and A10 mostly come down to reviewing how the application logs and handles failure, which is closer to a design review than a scan.

Automated Security Testing: Shifting Left Without Slowing Down

Shifting left means running security checks as early in development as possible, when fixes are cheapest. In practice, that means wiring automated security testing into the pipeline so it runs without anyone having to remember to trigger it.

A workable pipeline in security testing QA automation layout looks like this:

Pre-commit and IDE: This happens on the developer’s local machine before they share their work. By running lightweight security checks here, developers can fix issues immediately, similar to how a spell-checker catches a typo while you are typing a sentence. This prevents bad code from ever leaving the developer’s laptop.

Pull Request (PR): A PR is the process of submitting code to be merged into the main project branch. At this stage, the team performs a deeper analysis. Because the code is about to become part of the shared application, running full security scans here acts as a gatekeeper, ensuring no new vulnerabilities are introduced into the core codebase.

Build: This is the automated assembly process where the code is compiled, packaged, and turned into a runnable application. Since this stage creates the actual artifacts (like container images) that will be deployed, it is the right time to check that those packages themselves and the infrastructure code defining how they run are secure.

Staging: This is an environment that mirrors the real, live environment as closely as possible. Since the application is actually running here, it allows for more sophisticated security testing that requires a live, functional stack, such as testing how the app behaves when an attacker sends it unexpected requests.

Production: This is the live, user-facing environment. Because this is the “real world,” security testing here focuses on continuous monitoring, constantly scanning the live infrastructure for new threats or configuration issues that might have appeared since the last deployment.

Security Testing Tools Worth Knowing in 2026

This list includes some of the most recommended tools for security testing in 2026, grouped by what they do.

SAST: Static Application Security Testing

Best tools for SAST are:

  • Semgrep: Fast, open-source, and ideal for custom pattern-based checks.
  • CodeQL: GitHub’s powerful semantic analysis engine; treats code as a database.
  • Checkmarx / Veracode: Established enterprise platforms offering broad coverage and reporting.

DAST (Dynamic Application Security Testing)

Best tools for DAST include:

  • ZAP: Highly popular, open-source scanner with strong automation capabilities.
  • Burp Suite: Industry standard for manual penetration testing, with automated scanning in the Professional version.

SCA (Software Composition Analysis)

Most recommended tools for SCA include:

  • Snyk: Developer-centric tool that integrates into workflows and can automate dependency fix requests.
  • Trivy: All-in-one scanner for containers, filesystems, and infrastructure-as-code.

IAST (Interactive Application Security Testing)

Expert-recommended tools for IAST include:

  • Contrast Security / Checkmarx IAST: These require installing a runtime agent within the application to monitor code behavior.

TestFiesta Brings Your Security Testing Evidence Into a Consolidated Room

The most common problem with security testing is not finding vulnerabilities. It is proving, at release time, that the ones that mattered got fixed and retested. 

Security findings tend to live in five different places: a SAST dashboard, a DAST report PDF, a pen test spreadsheet from the vendor, and retest evidence somewhere in Slack. When a stakeholder asks whether the release is safe to ship, nobody can answer from one screen.

TestFiesta gives security testing the same structure as every other test type, so the evidence lives alongside your functional and regression results instead of in a separate silo.

  • Security test cases live next to functional ones. Write test cases for each OWASP category, tag them by risk area, and group them into the same test runs and milestones your team already uses. Custom tags mean you can filter a run down to just the A01 access control checks or just the API authorization tests when someone asks.
  • Automated results feed in through the API. TestFiesta’s automation API accepts results from your pipeline, so automated and manual test outcomes sit in one consolidated view. Custom fields are built for mapping data from automated tests, so you can capture the details you need alongside each result.
  • Findings become tracked defects with full traceability. A failed security check becomes a defect linked to the exact test and execution that found it. Attach screenshots, logs, and files. Assign it to a developer, and when they push a fix, reassign it to QA for verification. The defect record shows the whole chain from discovery to retest.
  • Jira and GitHub stay in sync. For teams that track engineering work elsewhere, defects sync to Jira or GitHub issues with the test context attached, so developers see what failed and how to reproduce it without leaving their tracker.
  • Reporting covers security tests like everything else. Because security tests are tagged and tracked alongside functional ones, they appear in the same reports, without stitching together exports from five tools.

‍

Don’t let critical security insights get lost across fragmented tools and separate dashboards.

Break down testing silos by bringing your results into a single, cohesive view.

Sign up for a free trial today

FAQs

Can automated security testing replace penetration testing?

No, automated security testing catches known vulnerability patterns quickly and repeatedly, which is exactly what you want in a pipeline. It does not catch business logic flaws, chained vulnerabilities, or anything that requires understanding what the application is for. Penetration testing covers that gap. 

How often should security testing be performed?

It depends on the testing type. SAST and SCA should run on every pull request or build, since new code and new CVEs arrive daily. DAST should run against staging on every deploy or at least weekly. Penetration testing is typically done before major releases and on an annual cadence for compliance, though high-risk applications warrant more frequent testing.

What’s the difference between SAST and DAST, and which one should I start with?

SAST analyzes source code without running it and finds issues early, with line-level detail but more false positives. DAST tests the running application from the outside and finds runtime and configuration issues, but cannot point to the line of code responsible. If you are starting from scratch, start with SAST plus SCA on pull requests. They are the cheapest to set up, run earliest, and cover the widest range of OWASP categories. Add DAST once you have a stable staging environment to point it at.

Testing guide
Best practices

Introduction

In software development, your code can pass every unit test, yet still fail the moment a customer tries to complete a purchase. This disconnect between “passing tests” and “working products” is why end-to-end (E2E) testing is the most critical safety net in your CI/CD pipeline. This guide explores how to build a robust E2E strategy in 2026, from choosing the right frameworks to mastering the workflows that actually catch bugs before your users do.

What Is End-to-End Testing

End-to-end testing (E2E testing) validates a complete user journey through an application, from the first interaction to the final outcome, across every layer of the system. Instead of checking whether one function returns the right value, an E2E test asks a bigger question: can a user actually accomplish the thing they came to do?

A typical E2E test for an ecommerce app might sign up a new user, search for a product, add it to the cart, apply a discount code, pay with a test card, and confirm that the order appears in the account history and the confirmation email fires. If any layer fails along the way, whether that is the frontend, an API, the database, or a third-party payment gateway, the test fails.

That is the defining trait of E2E testing. It exercises the system the way a user experiences it, in a test environment as close to production as possible. It is the slowest and most expensive type of test to run and maintain, which is why it sits at the top of the testing pyramid. You write fewer E2E tests than any other kind, and you reserve them for the journeys that matter most.

What Does an E2E Test Cover

A single well-designed E2E test touches more of your system than any other test type. In one run, it can cover:

  • The full UI flow from first click to final confirmation. Every page load, form submission, button click, and redirect that a user passes through is verified in a real browser.
  • API calls and backend responses are triggered by user actions. The test does not call APIs directly. It triggers them the way a user would and verifies that the results surface correctly in the interface.
  • Database reads and writes across the entire transaction. An order placed in the UI should exist in the database with the right status, quantity, and user association. E2E tests confirm data persists correctly, not just that a success message appeared.
  • Third-party integrations. Payment gateways, email services, auth providers, and shipping APIs are where many production failures originate because teams do not control that code. E2E tests are often the only tests that exercise these boundaries realistically.
  • State that accumulates across multiple screens or requests. Session data, cart contents, multi-step form progress, and permissions all carry state between steps. Unit tests cannot catch a cart that empties itself between the shipping page and the payment page. An E2E test catches it immediately.

End-to-End Testing vs Unit Testing vs Integration Testing

These three test types answer different questions, and a healthy suite needs all of them.

Unit tests verify a single function, method, or component in isolation, with all dependencies mocked. They answer: Does this piece of code do what it should? They run in milliseconds, pinpoint failures precisely, and make up the bulk of a healthy test suite.

Integration tests verify that two or more modules work together correctly, such as a service and its database, or two internal APIs exchanging data. They answer: Do these pieces communicate correctly? They use real connections between the components under test but do not simulate a full user journey.

End-to-end tests verify the entire system through the user’s interface. They answer: Does the whole product work for a real user? They mock nothing, or as little as possible, and run against a deployed environment.

Unit tests are fast, cheap, and precise but blind to interaction bugs. Integration tests catch contract mismatches and data-flow issues between modules but still miss UI-level and cross-system failures. E2E tests catch the failures users actually hit but are slow, environment-dependent, and harder to debug because a failure could originate anywhere in the stack.

Types of End-to-End Testing

E2E testing can be classified into two broad categories:

Horizontal E2E: Tests a complete business workflow across multiple features or systems, usually at the same level of the application. Login → Search product → Add to cart → Checkout → Payment → Order confirmation

Vertical E2E: Tests a single feature or business capability through all the technical layers involved. UI → Frontend → API → Payment Service → Database → Response → UI

In addition to horizontal and vertical, E2E tests can also be grouped by what and how they test. These types include:

1. UI-Driven E2E Testing

UI-driven E2E testing is a framework that drives a real browser, clicks through the interface, and asserts on what the user would see. It provides the highest-fidelity validation of the actual user experience, and it is also the slowest and most brittle form, since every UI change can affect the test. Use it for journeys where visual and interactive correctness is the point, such as sign-up, checkout, and onboarding.

2. API-Assisted E2E Testing

API-assisted E2E testing is a hybrid approach that keeps the E2E scope but moves setup and verification out of the UI. Instead of clicking through login and product creation to test checkout, the test seeds state through API calls, performs only the journey under test in the browser, and then verifies outcomes through the API or database. This cuts run time and flakiness dramatically without sacrificing coverage of the flow that matters. Most mature teams shift toward this model as suites grow.

3. Cross-Browser and Cross-Device E2E Testing

Cross-browser and cross-device E2E testing follows the same journeys, verified across Chromium, Firefox, and WebKit engines, and across viewport sizes and mobile devices. Rendering engines and mobile browsers still behave differently enough that a flow passing in Chrome can break in Safari. Teams usually run their full suite on one primary browser and a smaller smoke set across the rest, expanding coverage where analytics show real user traffic.

4. Business-Critical Regression E2E Testing

Business-critical regression E2E testing is a curated subset of E2E tests protecting the flows the business cannot afford to break, such as payments, authentication, and data export. They run on every release regardless of what changed. This set is intentionally small, aggressively maintained, and treated as a release gate. If a test in this tier fails, the release stops.

How to Write and Run E2E Tests: A Step-by-Step Workflow

Here’s a step-by-step guide to writing and running E2E tests:

1. Map your critical user journeys

Start from revenue and risk, not from feature lists. List the journeys where failure costs money, data, or trust: signup, login, checkout, subscription changes, or core workflow completion. Rank them. Your first E2E tests cover the top of that list, and nothing else, until those are stable.

2. Define pass conditions in user terms

Write each test’s success criteria before writing code, phrased as outcomes a user or the business would recognize: “the order appears in order history with status Confirmed,” not “the POST returns 201.” This keeps tests honest about what they actually verify and makes failures readable to non-engineers.

3. Choose your tool based on your stack

Match the tool to your team’s languages, your app’s platforms, and your CI constraints rather than picking whatever is available. A JavaScript team testing a web app has different needs than a Java shop maintaining a legacy grid or a mobile team covering native iOS and Android. 

4. Write tests with the Arrange-Act-Assert-Teardown pattern

Arrange the preconditions (seed a user, load a product), act out the journey, assert the outcomes, then tear down so the next run starts clean. Tests that depend on leftover state from previous runs are the single most common source of E2E flakiness. Each test should be able to run alone, in any order, and pass.

5. Use stable, intent-based selectors

Target elements by role, accessible name, or dedicated test IDs instead of CSS classes or DOM position. A selector like getByRole('button', { name: 'Place order' }) survives a redesign. One tied to .btn-primary:nth-child(3) does not. This one habit eliminates a large share of maintenance work over a suite's lifetime.

6. Integrate into CI/CD in two tiers

Run a fast smoke tier, roughly five to fifteen of your most critical journeys, on every pull request, keeping feedback under ten minutes. Run the full suite on merges to main and on a schedule. Gating every PR on the full suite slows the team and trains developers to ignore red builds. Gating nothing means E2E failures pile up unnoticed.

7. Track and triage flakiness

Treat a flaky test as a defect with an owner and a deadline, not background noise. Quarantine tests that fail intermittently so they stop blocking builds, then fix or delete them within a sprint. Track pass rates per test over time. A suite the team does not trust is worse than a smaller suite it does, because people start merging past failures.

What Is Automated End-to-End Testing

Automated end-to-end (E2E) testing replaces manual, human-driven user journey verification with scripts that execute actions against a real browser or device on demand or on a schedule. By performing the same tasks as a manual tester, but repeatably and in parallel, automation enables teams to scale regression of core application flows, which is not feasible with manual effort alone. While manual testing remains valuable for exploratory sessions to catch unexpected usability issues, automated E2E testing is essential for efficiently verifying stable, business-critical journeys across multiple browsers simultaneously.

A good rule is to automate journeys that are stable, repeated every release, and business-critical. Keep manual effort for new features still in flux, edge cases hit once, and exploratory work. Automating a flow whose UI changes weekly buys you a maintenance burden, not coverage.

End-to-End Testing Tools and Frameworks in 2026

Here’s a brief guide to the most useful tools and frameworks for end-to-end testing in 2026:

  • Playwright. Playwright is the top recommendation for new web E2E suites. It supports Chromium, Firefox, and WebKit through a single API, featuring auto-waiting, parallel execution, and built-in debugging. With support for JavaScript, TypeScript, Python, Java, and .NET, it is the ideal choice for new projects without legacy constraints.
  • Cypress. Cypress is a JavaScript framework that executes tests directly within the browser, offering a superior interactive developer experience with time-travel debugging and auto-waiting. Version 15 introduced AI-assisted test authoring. While it lacks native mobile support and broad cross-browser coverage compared to Playwright, it remains an excellent choice for frontend-focused JavaScript teams working primarily in Chromium.
  • Selenium. Selenium is the veteran enterprise standard. It implements the W3C WebDriver protocol, offering the broadest language and browser support available. Recent updates include WebDriver BiDi support and native Kubernetes provisioning for Selenium Grid. While slower and requiring more setup than modern alternatives, it remains the optimal choice for polyglot organizations with significant existing investment.
  • Appium. The industry standard for mobile E2E testing, Appium automates native, hybrid, and mobile web apps across Android and iOS using the WebDriver protocol. While it requires significant setup and maintenance due to platform-specific quirks, it remains the most comprehensive open-source option for cross-platform native app coverage.
  • AI-Native E2E Platforms. Tools like testRigor, Katalon, and mabl use natural language and self-healing locators to minimize test maintenance. While these platforms reduce the need for deep automation engineering expertise, they often involve vendor lock-in and provide less granular control than code-based frameworks. They are best used as a supplement to code-based suites.

Why TestFiesta Exists at the Exact Layer Where E2E Testing Gets Hard

None of the frameworks above solve the problem that actually kills E2E programs, not writing tests, but managing them. Once a suite runs across two frameworks, three browsers, and every pull request, the questions shift. Which journeys are covered and which are not, why did this test pass on main but fail on the release branch, and which failures are real defects as opposed to flaky infrastructure?

TestFiesta sits at that layer. Its automation API ingests results directly from your automation framework, so automated and manual test outcomes land in one consolidated view instead of scattered CI logs. Custom fields carry your automation metadata, such as browser, environment, and build number, into every result.

For the manual side of E2E coverage, shared steps let you define a flow like login or checkout once and reuse it across test cases, and configurations let one test case run against dozens of browser and environment combinations without duplication. AI test case generation cuts authoring time for structured E2E scenarios, pulling steps and expected results from requirements docs or a prompt.

When an E2E run surfaces a real defect, built-in bug tracking ties it to the exact test and execution that found it, and the Jira and GitHub integrations turn failed tests into issues with full context attached. Every feature ships in one plan at $10 per user per month, with no feature gating between tiers.

Stop digging through fragmented CI logs and start managing your E2E strategy with clarity.

Start your free trial today

FAQs

How many E2E tests should a healthy test suite have?

A healthy test suite does not need a lot of E2E tests. Most teams land between 20 and 100 E2E tests covering critical journeys, with unit and integration tests handling everything else. 

Should E2E tests run on every pull request or only before release?

E2E tests run on pull requests as well as before release. Most teams run a small smoke test of their product’s most critical journeys on every pull request, and then run a full suite before the release.

Testing guide

Ready for a Platform that Works

The Way You Do?

Stop fighting your tools. Start shipping with confidence. TestFiesta adapts to your workflow, not the other way around.

Welcome to the fiesta!